Current Partnerships
We at CVT are not in this fight alone. We’ve partnered with numerous organizations aiming to deploy visualizations and research to help fight COVID-19. Check out our current partners!
-
Masterlists of resources (May 14th)
-
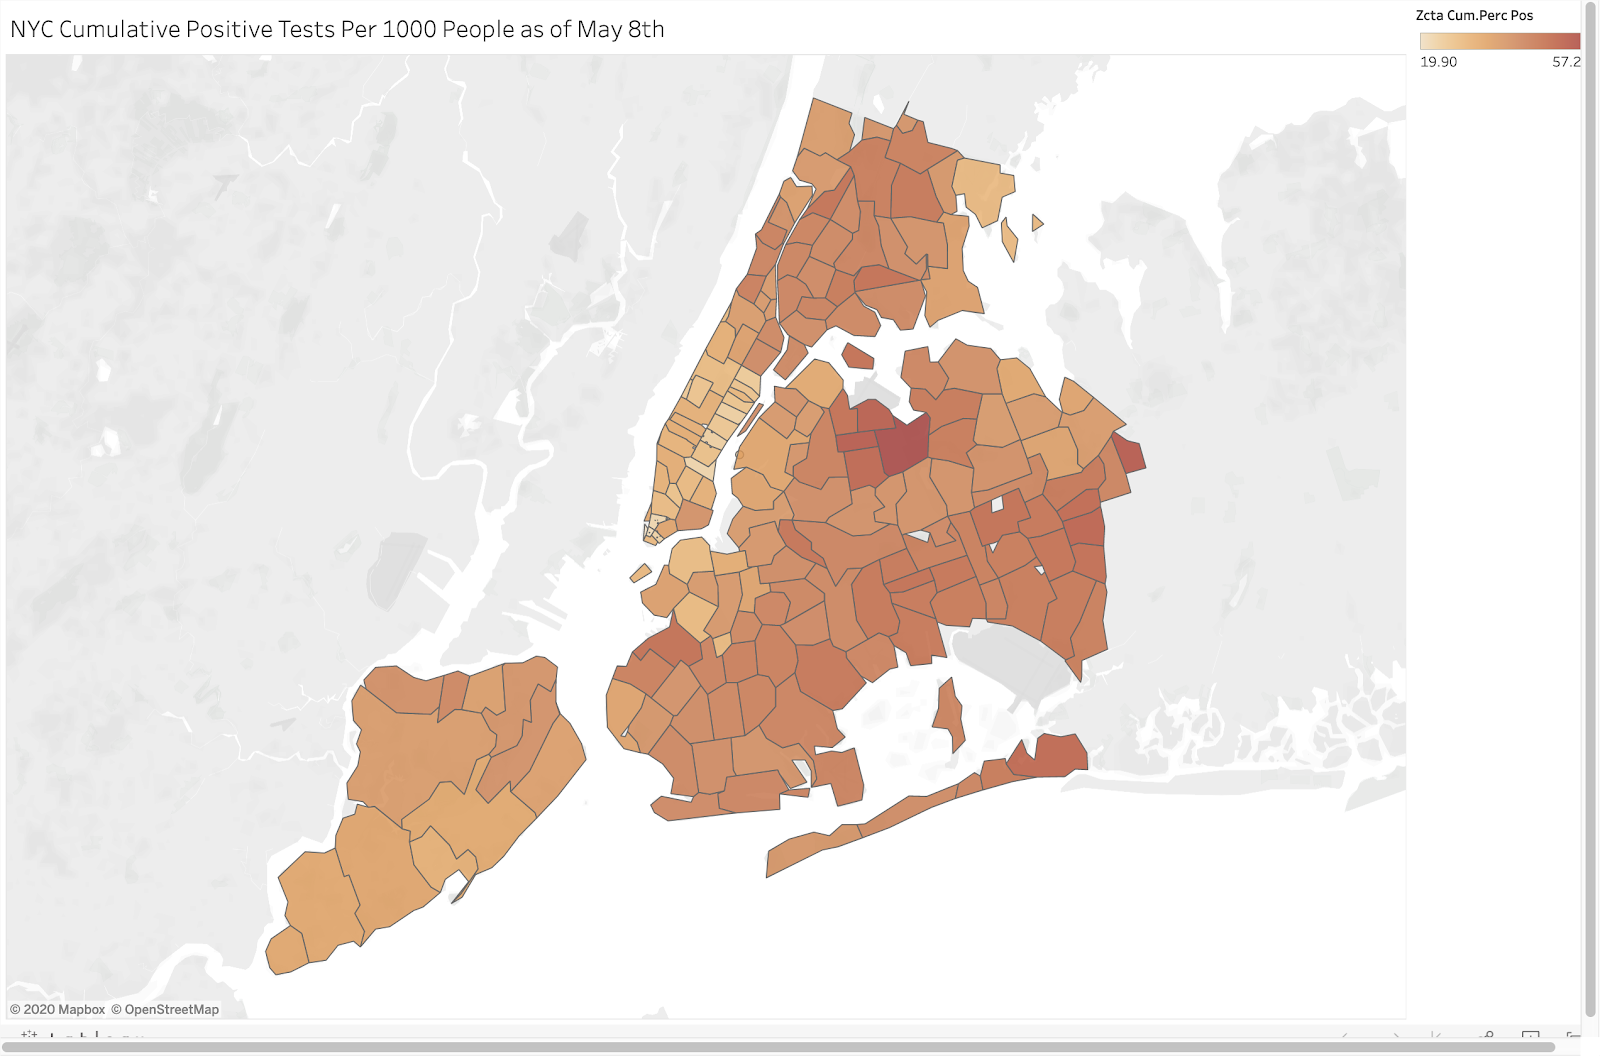
Cases in NYC (May 8th)
-
COVID-19's Impact on American Oil (May 4th)
-
PM 2.5 Levels Across the US (April 27th)
-
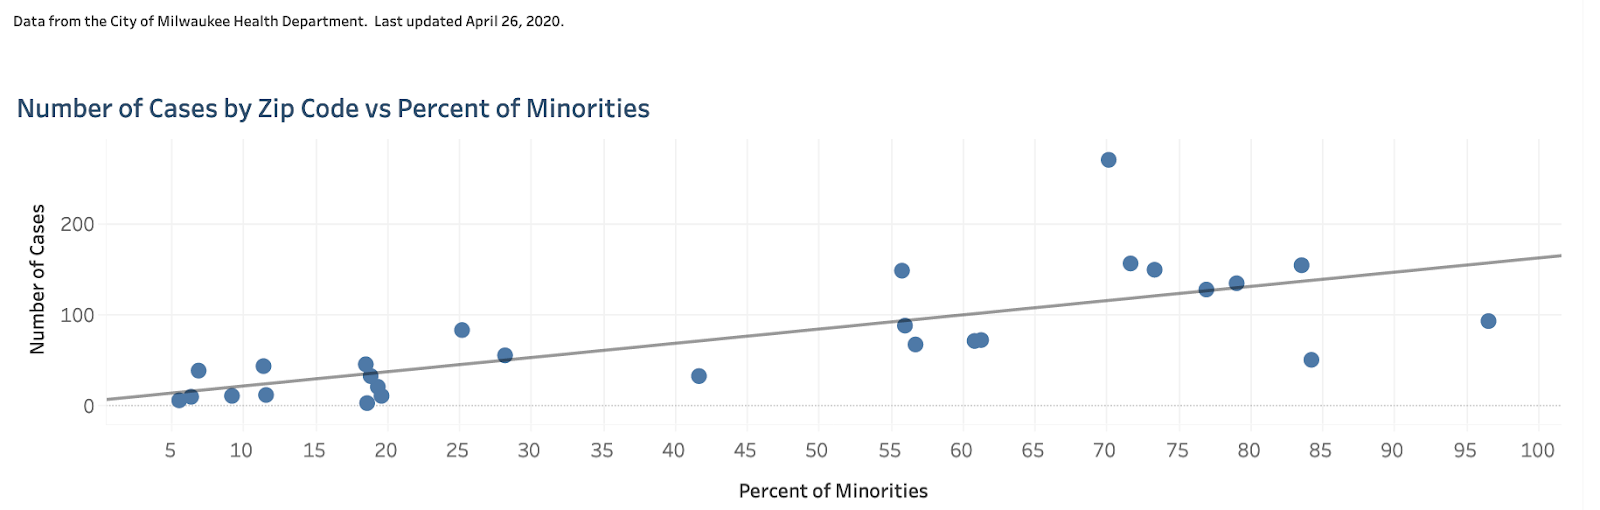
Cases vs Percentage Minority in Milwaukee City Zip Code (April 26th)
-
Website connecting mask donors and recipients (April 21st)
-
Resource spreadsheet and presentation for people to find and give help for the fight (April 17th)
-
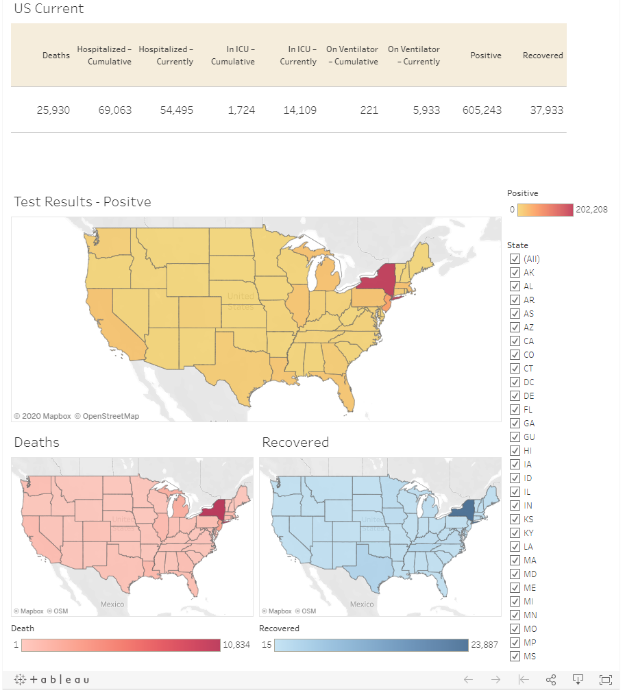
Self-updating visualizations of basic COVID-19 stats in the United States (April 15th)
-
Visualization of unemployment by each state in the last four weeks (April 10th)
-
Unemployment Rate by County in February (April 17th)
-
Max Unemployment Insurance Claims (April 20th)
-
-
Dashboard and presentation on COVID-19 in the state of Georgia (April 1st)
Screenshots of Sample Work
Important Links Current Projects
The heart of CVT is the projects we’re working on right now. If you’re not sure which project you like, let Lucas or Scotty know, and they can assign you. Here are some proposal links.
Economic Impact
Project Lead(s)
Marco Ribeiro
Project Description
The main goal of this project is to collect and provide information about the Economic consequences of the COVID pandemic. There are several data available regarding the health impact of the virus, however, economic data, especially in an industry-specific and state/county level is scarce. In the near future, governments will need to balance the Health and Economic impacts when making crucial decisions regarding social distancing and lockdowns. Either through visualization platforms like Tableau and ArcGIS or through academic papers reflecting on the data collected, we aim to have a real impact by helping policymakers and informing the general public. We want to use economic measures to measure what has changed because of the pandemic, how much it has changed, and why.
Understanding the Economic Impact of COVID-19 on the Hospitality Industry
Project Leads(s)
Adway Wadekar
Project Description
The goal of this project is to understand the impact of COVID-19 on the hospitality industry. The hospitality is very complex and has a variety of different parts. It can even be considered to be a microcosm for different human behaviors. As a result, understanding how certain parts of the hospitality industry vary effect-wise, during, and after COVID-19 could prove to be incredibly important. We will use a data-driven approach to studying this using as much data as we can possibly find in the hospitality industry. Hopefully, this will result in a publication of some sort — whether it be in the news, or otherwise.
Avoiding a Covid-19 Depression
Project Leads(s)
Calel Colon and Viraj Mehta
Project Description
The focus of this project is to analyze the direction of the economy based on the implementation of current short-term banking policies, analysis of the PPP, EILP, and other business relief programs and their effectivity, the current state of US treasuries and what their lower interest rates as a result of recent federal reserve policy could mean for government funding and investors. Overall, we are trying to reveal the true economic desperation of the economy right now that conventional news media is not focusing on in order to maintain public confidence. The project also serves to provide different solutions and the economic results that can be expected from them.
Harvard Opportunity Insights (OI) Research
Project Lead(s)
Lucas Chu and Brandon Wong
Project Description
This project is assisting Opportunity Insights by collecting county-level economic data, particularly unemployment insurance claims and bankruptcy claims. The focal point of this project would be a collection of real-time public data to create well-processed, high-quality datasets from unstructured data which will be analyzed by researchers and be used to translate these research findings into policy change. Our main deliverable is a github and airtable of links.
For real-life problems and insights into the same, we need data that originated from the problem domains. Some of the important tasks in this research project include Data selection: the selection of the right features for a particular dataset, Data preprocessing and sampling: organizing and formatting the data, cleaning the data, and Feature Engineering and extraction: optimizing the number of features and Data Conversion: Scaling and Composition-combining different features into a single feature; to create datasets with balanced taxonomy, sufficient data, high-quality labels/data, minimal errors and diversification of samples.
FinTech Challenges and Opportunities
Project Lead(s)
Ali
Project Description
The focus of this project revolves around an impact study, a quantitative analysis of industry markets, and a review on strategies uptaken by the three largest U.S. financial technology companies: Stripe, Ripple, and Coinbase. We are currently evaluating the impact COVID-19 has had on FinTech, the effectiveness of strategies to meet an increase in service demands, new challenges and opportunities, as well as the impact on small businesses through loans provided by Fintech companies. Members will work on compiling data from FinTech information companies such as CB Insights and then analyzing to find successful reactions to increases/decreases in demand and resources. The goal of this project is to provide startup companies in the FinTech industry with information and strategies on how to survive in the current and upcoming economic climate.
COVID-19 in South Korea
Project Lead(s)
Dr. Sunghoon Lee from EDGC, Tyler Kim
Project Description
*This project involves significant collaboration and communication with EDGC — The parent company of SOLGENT, one of the largest distributors of testing kits to Korea and US*
The main focus of this project is to study and analyze actions of Korea that allowed them to successfully manage COVID-19 in three parts: Government Policies and Laws, Use of Innovative Technology, and Healthcare Systems. We are establishing partnerships with several healthcare companies in Korea that contributed to the containment of COVID-19 including Eone Diagnomics Genome Center, Solgent, and mygenomebox. Partnerships with these companies will allow us to access valuable data SDK, specifically on testing kits and healthcare systems, public health policy expertise through interviews, and valuable networks. Members will work on creating visualizations based on the data provided by these companies, conduct direct interviews with the EDGC COVID-19 Response Team, and participate in possible collaboration projects.
Analyzing PPE Supply and Demand in NYC
Partnership Lead(s)
Kripa and Jonathan from COVID Foundation
En Yu Yap and Melissa Jones from CVT
Project Description
The main focus of this project is to use public data from the Census Bureau and the New York City Department of Health and private data from the COVID Foundation and Last Mile to predict PPE demand and supply, as well as to help coordinate shipments of over $1m worth in articles of PPE in collaboration with Supply Crate and Helpful Engineering.
Porting Community Resource Maps
Partnership Lead(s)
Rara from GroundBreakers; Miranda and Sam from Reach4Help and João from Hospitals in Need (Helpful Engineering)
Lucas Chu and Scott Blender from CVT
Project Description
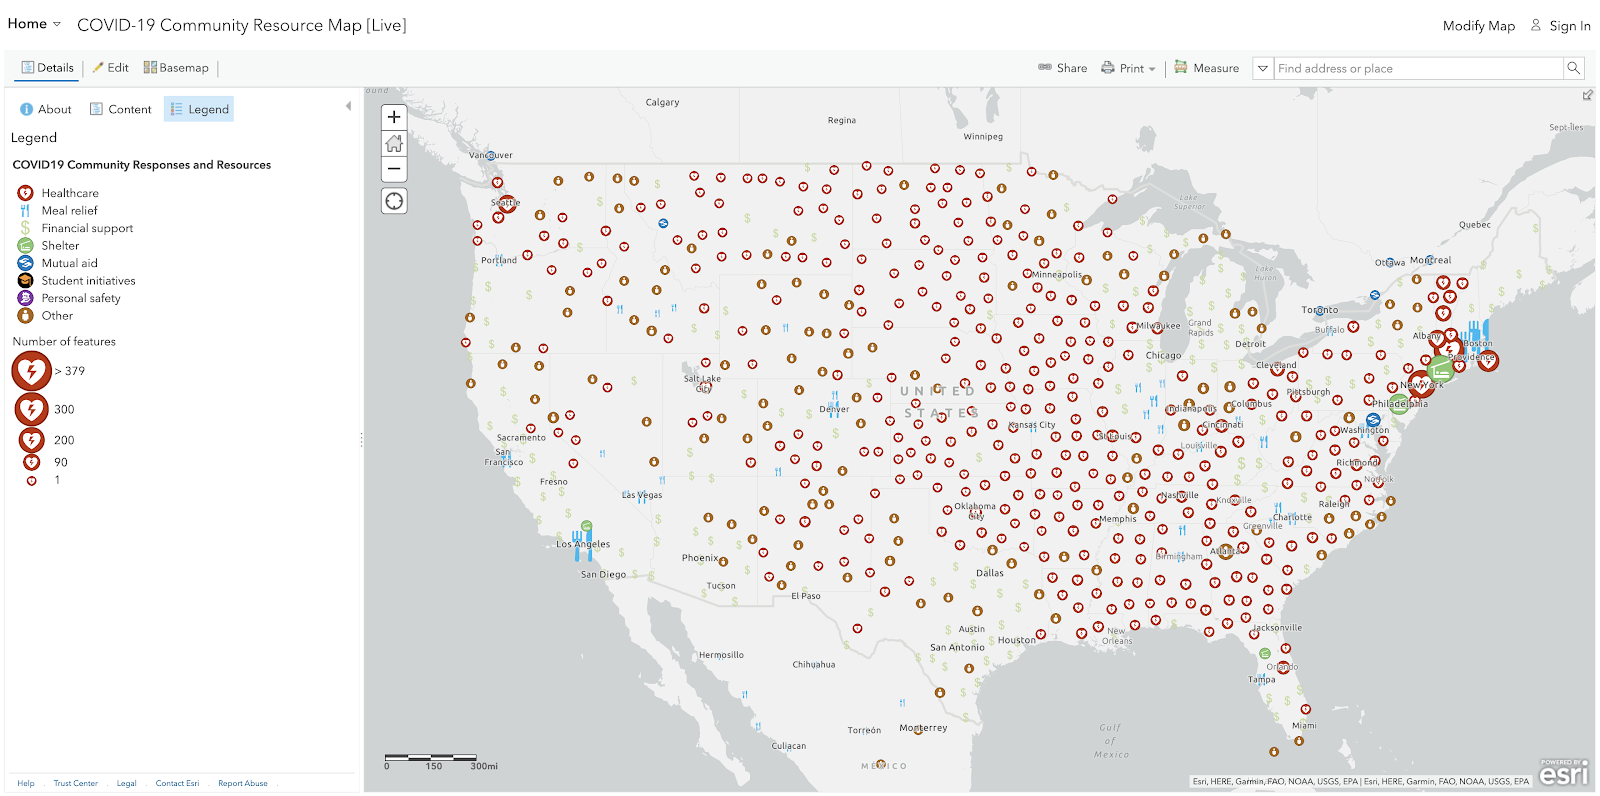
The main focus of this project is to port https://groundbreakers.maps.arcgis.com/home/webmap/viewer.html?webmap=fc... to phone apps, help connect it to translators, and connect mutual aid datasets through Reach4Help.
Fact-Checking the EPA
Project Lead(s)
Emily Chang (echang22911@yahoo.com)
Project Description
The whole premise of the project is to determine whether the goals of the EPA's environmental rollbacks were met during the coronavirus outbreak. The agency believed that rolling back air pollution regulations would help fossil fuel industries during this difficult economic period and would not harm the environment. The project will be looking into climate and economic data to back up our recommendation to the EPA on whether they should reinstall these air pollution regulations as they prevent pollutants, such as PM 2.5, from harming public health.
Harvard Center for Geographic Analysis (CGA)
Partnership Lead(s)
Dr. Wendy Guan from the CGA and Dr. Dexuan Sha from George Mason University
Scott Blender, Justina Chua, Viraj Kacker, and Ritvik Ramakrishnan from CVT
Partnership Description
This partnership consists of a series of tasks in coordination with CGA for members to work on. Significant contribution will be credited with co-authorship. Please visit the spreadsheet linked below to learn more about projects and tasks: Current and Future Projects CGA-CVT
Project(s) List:
-
Public Health Modeling
-
Infectious disease transmission; Socioeconomic/Climate Weather Relation; Operational Adjustments and Tests
-
-
GDELT
-
News; Sentiment Variations; Policy/Reactions
-
-
Spatiotemporal Cube
-
Data Cube for Virus Cases (confirmed, recovered); News/Policy; Climate Effects
-
-
Environmental
-
Policy; Lockdown for Countries
-
-
Standardized Data Sets
-
Workflow built off of current (or in progress0 available models of one location and applied to others
-
-
Climate/Weather/Socioeconomic Data
-
Observing air pollution and socioeconomic data and its geospatial impact
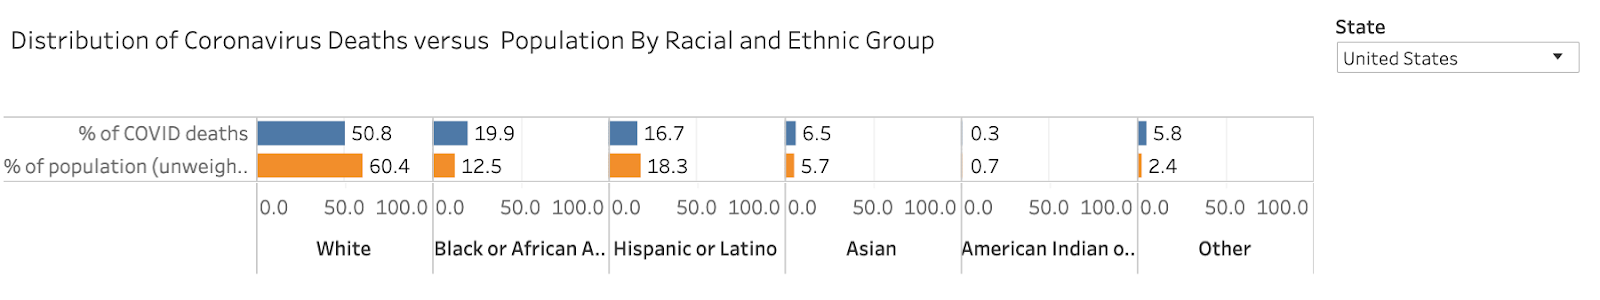
COVID and Climate Change
Project Lead(s)
Jessica Nemeth and Maanasa Mendu
Project Description
The focus of this project is to investigate the effects of the COVID19 pandemic on pre-existing economic and social inequities that are propelled by climate
change. There are many datasets that record air quality in various places and update this in real-time to a dataset. This project will create geospatial visualizations of air quality before and after the COVID19 pandemic in various communities, conduct data analysis on the data collected, and ultimately see the correlation of this data with household income/racial trends of various communities that can prove useful in both determining the likelihood of communities becoming infected with the coronavirus and in proposing policy.
Tracking Coronavirus-related Data
Project Lead(s)
Lucas Chu
Project Description
This project is the namesake of the CVT: we will be investigating more pandemic data, like finding differences in case reports, calculating CFR, graphing air emissions, etc… Add ideas here. This project is recommended as it has the biggest .
3D Printer and Hospital Location Map
Project Lead(s)
EJ, and Akhil Kumar (Scotty and Viraj as needed)
Project Description
The goal of this project is to create a map in ArcGIS that displays hospitals and nearby 3D printing facilities that are producing medical supplies (ventilators, facemasks). It seeks to efficiently connect hospitals to nearby suppliers. The end goal of this project is to create an interactive interface that can allow hospitals in need to request the necessary supplies from the closest 3D printing facilities. This project relies on reaching out to equipment makers and hospitals to acquire the information above. 3D printer list here.
Time-Series Geospatial Visualization for Before and After COVID-19
Project Lead(s)
Viraj Kacker and Ritvik Ramakrishnan
Project Description
The goal of this project is to create a geospatial dashboard that observes various factors before and after the COVID19 pandemic. These factors include average deaths per state, crime per state, and internet usage per state in an effort to visualize how COVID19 has affected our community.
Marketing, Outreach, and Partnerships
Project Lead(s)
Tess, Lucas, and Arthur De Belen
Project Description
The focus of this project is contacting MIT Innovation Initiative, Harvard Innovation Labs and other organizations (such as campus publications and data science clubs) for partnerships and help. Another focus of this project is taking advantage of and applying to the many hundreds of thousands of dollars in funding and credits available. What we would like to obtain from the partnerships and grants we apply to consists of (1) having more resources that can be used to support the research that other projects are working on, (2) increasing awareness of CVT, so that more people can help with our projects and help us work towards our mission of helping the general public understand the situation with COVID-19, and (3) spreading the information we gather and the media we prepare to a larger audience.
COVID-19 Infection Prediction
Project Lead(s)
Christopher Nguyen and Lakshay Sood
Project Description
The “COVID-19 Infection Prediction” (CIP) project is extremely interesting in that it has a potentially simple conclusion, but one that is complicated to reach. The probability of catching the coronavirus is a function of several variables, such as age; location; what time you leave your house during lockdown; health guidelines; and length of time between exposure and infection. This list of variables is far from comprehensive, with some being more difficult to work with than others. The crowning achievement will be an easy-to-use function that informs policymakers and the general public on the probability of specific people contracting COVID-19, based on their surrounding environment.
Why is COVID-19 spreading faster in certain areas?
Project Lead(s)
Michael and Anass
Project Description
The goal of this project is to track certain factors that contribute to the faster spread of COVID-19 in certain regions. The end goal of this project would be to publish a paper explaining the correlatory variables and also host a dashboard/data repository.
211 Project
Project Lead(s)
Caitlyn Tran and Scott Blender
Project Description
The 211 project seeks to deliver facts about average people: their needs, requests, and services they ask for from data sourced from United Ways locations across each state. Currently, we are working on gathering data available from the Wisconsin department and will further expand our outreach to additional states as we build our proof-of-concept. The main deliverable will be handled with ArcGIS, where we can create a geospatial dashboard that displays the statistics we choose to cover before and after the COVID-19 pandemic.
Dataset Collection
Project Lead(s)
TBD
Project Description
This project is a continuation of research. Members are expected to compile, annotate, and evaluate sources. The end result of this project is to publish data sets of our collected links for researchers to have quick-and-easy access to.
Collection of Resources
-
-
Support/tools
Here is the link to our application: http://bit.ly/CVT-apply
Questions? Email Us!If you have any questions, email us at: coronavirusvisualizationteam@gmail.com
Follow Us!Instagram: https://www.instagram.com/joincvt/
Twitter: https://www.twitter.com/joincvt
LinkedIn: https://www.linkedin.com/company/coronavirus-visualization-team/