
Abstract
China is currently the world’s largest emitter of carbon dioxide (CO2). China therefore has a key role in global climate change mitigation. Policies and commitments are required to enable decarbonization. In this Perspective, we summarize the key features of China’s CO2 emissions, its reduction processes and successes in meeting climate targets. China’s CO2 emissions reductions have been substantial: by 2020, carbon intensity decreased by 48.4% compared to 2005 levels, achieving objectives outlined in the Nationally Appropriate Mitigation Actions and Nationally Determined Contributions. These reductions rely on the achievements of sectoral and sub-national targets outlined by China’s Five-Year Plans. However, China still faces the challenges of reaching its peak total CO2 emissions before 2030 and achieving carbon neutrality before 2060. Key steps towards China’s carbon neutrality include increasing its non-fossil energy share, deploying negative-emission technologies at large scale, promoting regional low-carbon development and establishing a nationwide ‘green market’. To achieve these steps, top-down socio-economic development plans must coincide with bottom-up economic incentives and technology development.
Introduction
Owing to its rapid economic development and urbanization, China is currently the largest carbon emitter in the world, accounting for 28% of global CO2 emissions in 2019 (ref.1) (Fig. 1a). Its CO2 emissions surpassed those of the US in 2007, and those of the US, the 27 European Union countries (EU27) and the UK combined in 2012, reflecting an increase of 45% from 2007 to 2013 (ref.2). It was thought that China’s CO2 emissions had peaked, as suggested by the negative growth rates observed from around 2013 to 2016 (refs2,3,4). However, a rebound in emissions thereafter5,6 suggests that long-term reduction remains a key policy challenge for China and the world.
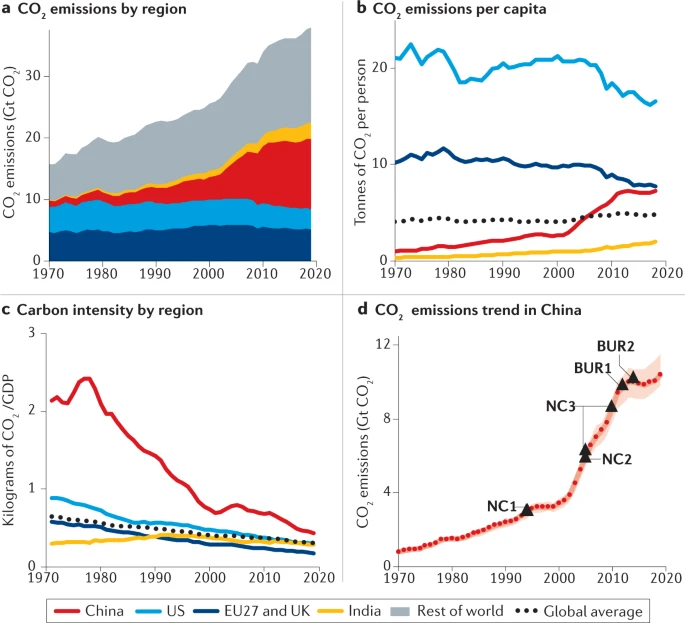
a | Annual CO2 emissions from fuel combustion and cement production1 in major emitting regions. b | CO2 emissions per capita181 in major emitting regions. c | Carbon intensity181 (carbon emissions per economic output) for major emitting regions. The EU27 incorporates: Austria, Belgium, Bulgaria, Croatia, Cyprus, Czechia, Denmark, Estonia, Finland, France, Germany, Greece, Hungary, Ireland, Italy, Latvia, Lithuania, Luxembourg, Malta, The Netherlands, Poland, Portugal, Romania, Slovakia, Slovenia, Spain and Sweden. d | CO2 emissions trends in China, from the GCP1, IEA10, BP11, EDGAR9, CDIAC182 and CEADs6,14 databases, and years in which emission inventories were submitted to the UNFCCC via National Commmunications (NC)174,183,184 and Biennial Update Reports (BUR)147,185. Red shading represents uncertainties among databases. China’s share in global CO2 emissions has increased rapidly since about 1980, with emissions per capita increasing substantially during the 2000s, but plateauing and fluctuating since 2010. GDP, gross domestic product.
Indeed, in recognition of the importance of China in determining the stabilization of the Earth’s climate7,8, many mitigation policies have been introduced. These include obligatory energy and carbon intensity targets stipulated in the Five-Year Plans (FYPs). Policies that specifically focus on emissions reductions have also been implemented, each supplanted by more stringent objectives. For example, in 2007 China’s National Leading Committee on Climate Change and The National Climate Change Program were established, introducing goals to reduce energy intensity and increase the share of non-fossil energy. The Nationally Appropriate Mitigation Actions (NAMAs) followed, as did China’s Intended Nationally Determined Contributions (INDCs) in 2015, the latter of which aimed to achieve 60–65% carbon intensity reductions by 2030 (from 2005 levels) and to reach peak emissions around 2030. Building on these objectives, in September 2020, President Xi further proposed a long-term mitigation goal of carbon neutrality before 2060, and in December 2020, enhanced the INDC targets to a >65% reduction in carbon intensity by 2030 from 2005 levels.
Achieving these targets, especially that of carbon neutrality before 2060, requires technological improvements and social-economic transitions. These include increasing the share of non-fossil energy, developing negative emission technologies, and measures to remove carbon from the air or to increase the carbon sink. The implementation of effective policies is also critical, such as launching low-carbon pilot projects, promoting the ‘green market’ and establishing market mechanisms in carbon emission trading.
In this Perspective, we assess the status of China’s carbon emissions and progress in its emission reduction plans, providing a basis for future decarbonization efforts. First, we outline the current standing of China’s CO2 emissions alongside the factors driving the changes observed. We subsequently assess China’s achievements towards low-carbon development, and discuss future prospects and challenges for further decarbonization, including reaching peak emissions before 2030 and achieving carbon neutralization before 2060. We end with recommendations for future research to facilitate future deep decarbonization. Unless specified, emissions refer to CO2 emissions throughout.
China’s carbon emissions
Carbon emissions in China have evolved alongside socio-economic development. The key features and drivers of this phenomenon are now described.
Key features
Before 1970, China’s total CO2 emissions were <900 Mt CO2, and per capita emissions were roughly a quarter of the global average9. However, since the reform and opening-up in the 1970s, and particularly after joining the World Trade Organization (WTO) in 2000, the economy grew rapidly along with CO2 emissions (Fig. 1a). Indeed, CO2 emissions in China increased by an average of 10% yr-1 in the 1970s, 5% yr-1 in the 1980s, 3% yr-1 in the 1990s, 9% yr-1 in the 2000s and 3% yr-1 in the 2010s1. Meanwhile, per capita CO2 emissions also increased, experiencing rapid growth during 2000–2013 and stabilization thereafter (Fig. 1b). Concurrently, carbon intensity (CO2 emissions per GDP) exhibited a downward trend since 1980 (Fig. 1c). As of 2019, these key features culminated in CO2 emissions of 10.3 Gt CO2 (±13%, confidence interval (CI) = 90%)1,9,10,11 and per capita CO2 emissions of around 7.4 t CO2 (ref.12) (Fig. 1d).
China’s CO2 emissions are mainly attributed to its fossil-based energy and manufacturing-based industrial systems. Coal, the primary energy source, was key to industrialization and urbanization13 and at present accounts for 75% of China’s carbon emissions6,14 (Fig. 2a). Indeed, China is regarded as the largest coal consumer in the world, burning over half of annual global coal consumption11. The past few decades, in particular, witnessed a surge in coal consumption, and although it seemed to decline in relation to carbon emissions during 2013–2016 (ref.15), consumption rebounded by 0.8% per year from 2017 to 2020 (refs5,16). Considering the wide range of emission factors and uncertainties in energy statistics, this coal-based emission structure results in a great deal of uncertainty in China’s carbon emission accounting17,18,19,20,21,22 (Box 1).

a | Emission flows of China’s CO2 emissions from sources to sectors in 2017 (refs6,14). b | Investment in fixed assets34, exports34, consumption34, GDP34, CO2 emissions6,14 and CO2/GDP relative to 1980; units are scaled such that 1980 represents 100. c | Industrial and energy production11,186,187,188 relative to 1980; units are scaled such that 1980 represents 100. China’s CO2 emissions are dominated by coal (from the perspective of fuel types) and by electricity production (from the perspective of sectors), all driven by rapid economic growth and energy demand.
Rapid industrialization has also established China as the world’s manufacturing powerhouse. Power generation and manufacturing sectors are, thus, the primary contributors to CO2 emissions, accounting for 44% and 38% of China’s CO2 emissions, respectively (Fig. 2a). In contrast, the transportation sector, residential sector and other sectors account for 8%, 5% and 6% of total CO2 emissions in China, respectively (Fig. 2a).
Along with regional disparities in technology, and its energy and economic structure, this sectoral breakdown of CO2 emissions also influences the uneven provincial distribution of CO2 emissions in China23,24. For example, provinces that are located within industrial clusters, such as Shandong and Hebei, exhibit a higher proportion of CO2 emissions from manufacturing sectors, especially from the production and smelting of non-metals and metals25. Inland provinces with rich fossil resources also emit vast quantities of CO2. For example, Inner Mongolia experienced a sixfold increase in CO2 emissions from 1997 to 2017, rising from 97 Mt CO2 to 639 Mt CO2 (refs6,14) (Fig. 3; Supplementary Table 1). Accordingly, the top six largest emitters in China in 2017, including eastern coastal provinces (such as Shandong, Jiangsu and Guangdong) and energy-based provinces (such as Hebei, Inner Mongolia and Henan), account for more than 40% of national CO2 emissions6 (Fig. 3; Supplementary Table 1).

Nevertheless, regional per capita CO2 emissions do not necessarily exhibit strong coupling to economic development. For example, cities in the Guangdong–Hong Kong–Macao Greater Bay Area accounted for 13% and 4% of the 2016 national GDP and CO2 emissions, respectively26. Yet, their carbon intensity and CO2 emissions per capita were 29% and 73% of the national average in the same year26. In contrast, several underdeveloped regions have higher per capita CO2 emissions. For example, per capita emissions in Ningxia were about 26 t CO2 per person in 2017 (refs6,27), greater than those of the US and almost four times greater than those of the EU. The high per capita CO2 emissions in these underdeveloped regions could be linked to two factors. First, eastern coastal provinces outsource their CO2 emissions to central and western regions by consuming electricity and industrial materials provided by them. For instance, about half of Inner Mongolia’s GDP is attributed to its export products, whereas over 30% of its generated power is exported to other provinces28,29. Consequently, the western and central regions have become net carbon exporters owing to the emissions embodied in the export products, as is evidenced by other regions in China outsourcing over 180 Mt CO2 from the central and western regions in 2012 (ref.30). Second, the economy of underdeveloped regions is more reliant on energy-intensive industries and infrastructure construction. For instance, the carbon intensities of Shanxi, Inner Mongolia and Ningxia are roughly 6, 7 and 14 times greater than that of Beijing in 2018, respectively12.
Driving factors
The increase in China’s CO2 emissions can be ascribed to its rapid economic growth and improving living standards31,32. Between 1978 and 2018, emissions resulting from the growth of GDP per capita were 176% higher than the overall change in CO2 emissions, completely offsetting the effects of improved energy intensity (−79%) and carbon intensity (−13%)32. Indeed, since the reform and opening-up in late 1970s, China’s GDP increased more than 30 times by 2017, averaging annual growth rates of around 10% from the 1980s to the 2000s33. However, since 2011, economic growth exhibited a marked slowdown, mainly owing to economic restructuring, averaging 7.4% in the 2010s34. At this time, CO2 emission growth rates concurrently decelerated35, particularly between 2013 and 2016, when emissions dropped temporarily2,36. Accordingly, there are indications that China’s economy entered a “new normal”37, characterized by the implementation of innovation-driven development, optimization of economic structure and maintenance of a medium-to-high pace of economic growth. A fundamental challenge for China to cut its emissions to near-zero is, therefore, to decouple its economic growth from increasing CO2 emissions.
Export, investment and consumption — known as the ‘troika’ of China’s economic growth — also enhance CO2 emissions on the demand side31, but with substantial temporal variability (Fig. 2b), as now discussed.
Trade and globalization
After joining the WTO in 2001, export was a temporary key contributor to emissions growth in China, accounting for nearly half of the annual emissions growth from 2002 to 2005 (refs38,39,40). In 2001, 24% of national production-based CO2 emissions were ascribed to exports41, and peaked in 2008 (ref.42). However, trade-induced emissions still represent a considerable proportion of the national total, linked to China becoming the world’s largest exporter in 2009 and corresponding international consumption43. For example, in 2017, 1.0 Gt CO2 emissions were embodied in trade, a more than doubling compared to 2000, contributing roughly one-tenth of total production-based emissions in the same year1.
After China’s trade-induced emissions peaked around 2008, a rapid increase in carbon emissions has been observed in other developing nations, especially in labour- and energy-intensive industries44,45. China, for instance, serves as a conduit of demand for manufactured goods in the global trade network, especially in rising South–South trade (trade among developing economies)45. In this case, China often imports raw materials and labour-intensive products from other developing nations, but exports mostly manufactured goods such as machinery45. This upgrade in South–South trade and the reallocation of low-end manufacturers from China to other developing countries could introduce additional global emissions owing to the higher emissions intensity in developing countries45,46,47.
The trade conflict between the US and China also introduces additional uncertainties in regard to embodied emissions. In 2004 and 2017, 300 Mt CO2 and 242 Mt CO2 were transferred from the US to China as a result of trade, respectively48. With an inevitable reduction in demand for Chinese products as a result of this conflict, resulting CO2 emissions will invariably be modified, but to an unknown level. Moreover, trade conflict could result in the isolation of western nations with regard to the global high-tech industrial chain, which could increase the difficulty of transitioning China to a low-carbon economy.
Investment and infrastructure construction
Although trade dominated emissions in the early 2000s, thereafter investment became the primary factor (Fig. 2b). Capital investments in fixed assets (including infrastructure and the real-estate economy) increased rapidly, exhibiting annual growth rates of 21% in the 2000s and 9% in the 2010s34. Consumption of industrial materials (steel and cement) and fossil energy (from coal and thermal electricity) also increased accordingly (Fig. 2c). As a result, from 2005 to 2007 and from 2007 to 2010, investment contributed 61% and 71% of emissions growth, respectively40,49.
Part of this growth and change can be attributed to government stimulation packages and interventions. Specifically, following the 2008 financial crisis, a four-trillion-yuan stimulation package was launched to encourage infrastructure construction nationwide. As a result, annual crude steel production, cement production and energy consumption increased by 14%, 15% and 5%, respectively, in 2009, contrasting with 3%, 5% and 3% in 2008 (ref.34). CO2 emissions therefore increased by 8.5% in 2009, substantially more than the 3.3% observed in 2008 (ref.14). Owing to this increase in national emissions, global emissions also exhibited growth in 2008–2009 despite the impact of the global financial crisis50,51,52.
As an additional example, from 2014–2016, the Chinese central government granted permitting new power plant project to provincial government. This regulatory change triggered a surge in thermal power plant construction, reportedly adding more than 250 GW of new power capacity between 2014 and 2018; 78% of these projects were coal power plants. Such an increase is almost comparable to the entire coal power plant fleet of the US (266 GW) in 2018 (ref.53).
In response to the COVID-19 pandemic, the Chinese government further proposed a set of stimulus projects to boost economic growth54, investing over 30 trillion yuan (US$4.5 trillion). China’s economy subsequently recovered very quickly, increasing by 2.3% in 2020. Annual CO2 emissions in 2020 also recovered to almost the same level as in 2019 (refs1,55). However, it is critical for China to achieve ‘green recovery’ in the post-pandemic era, decoupling economic recovery from emissions resumption.
Household and government consumption
Living standards in China have improved dramatically since the 1970s: as of 2017, per capita disposable income was 22.8 times higher compared to 1978 (ref.33). Accordingly, lifestyle transformations have resulted in a steep increase in household energy consumption and emissions56,57,58. For instance, total household carbon footprints (including direct emissions from household fuel consumption and indirect emissions from the supply chain of household goods and services) account for 34% of the national footprint in 2012 (ref.59). Moreover, from 1981 to 2002, electricity usage and the service sector was responsible for over half of the increased emissions attributed to urban household consumption31.
The carbon footprints of household consumption in China exhibit much spatial variability60, presenting challenges for China’s carbon neutrality. In general, urban and wealthy regions tend to have a greater carbon footprint; higher incomes drive lifestyles featuring an increased carbon footprint. For instance, cities in eastern coastal provinces have relatively higher household carbon footprints61: the top 5% of the population with the highest income in China contribute nearly 20% of the total household carbon footprint. That is, emissions equate to 6.4 t CO2 per capita59,60, 276% higher than the average of 1.7 t CO2 per capita across all households in 2012. In addition, during the period 2007–2012, 72% of China’s household carbon footprint was contributed by consumption in urban areas59.
Government consumption also has a role in driving national emissions. Indeed, government consumption contributed 10% to the total increase in CO2 emissions from 1981 to 2002 (ref.31). CO2 emissions induced by government consumption contributed 7%, 5%, 5% and 6% to the national CO2 emissions in 2002, 2007, 2012 and 2017 respectively35.
China has now entered a “new normal” phase in terms of its economic development, transitioning from an investment-driven economy to a consumption-driven economy35,62. This shift is likely to modify future carbon emissions, in turn influencing the balance of contributions from trade, investment and the improvement of people’s living standards reflected by household consumption49.
Decarbonizing China
Owing to the magnitude and rapid growth of China’s CO2 emissions — attributed to factors such as trade, consumption and investment — several policy-based mitigation approaches have been introduced to facilitate their reduction. The top-down command and control approaches (Table 1) are now discussed.
National and sub-national ambitions
A major contribution towards curbing carbon emissions in China has involved voluntary climate change commitments. Arguably the most important of these are the NAMAs and NDCs, which aim to reduce 2005 carbon intensity levels by 40–45% and over 65% by 2020 and 2030, respectively (Table 1). To do so, China primarily introduced top-down administrative measures, namely allocating national goals to local governments. For example, to meet carbon intensity reduction targets established in the 12th FYP (2011–2015), both central and local governments closed thousands of inefficient power plants and factories. The cumulative impact of these closures is equivalent to a reduction of 750 Mt in coal use and 1.5 Gt in CO2 emissions, the latter representing 5% of total global emissions in 2010 (ref.29).
The 13th FYP (2016–2020) also included carbon intensity reduction objectives, namely to cut 2020 energy intensity and carbon intensity by 15% and 18%, respectively, compared to 2015 levels (Table 1). To meet this goal, the 13th FYP aimed to increase China’s share of non-fossil energy supply to 15% and impose ultralow emission standards on all coal-fired power plants. These objectives were subsequently updated with the 14th FYP (2021–2025), including reducing carbon intensity by 18%, reducing energy intensity by 13.5% and increasing the share of non-fossil energy to around 20% by 2025 (Table 1). In 2020, China renewed its 2030 NDC targets, aiming to reduce carbon emissions per unit of GDP by over 65% compared with the 2005 level.
In the near future, China’s economy might enter into a phase of “carbon neutrality economy”. As such, President Xi stated that it is important to incorporate the peaking of carbon emissions and carbon neutrality into the overall layout of building an ecological civilization (Table 1). The Chinese government has thus embarked on several key tasks, including building a clean energy system, implementing energy conservation and emission reduction actions in different sectors, accelerating carbon emission trading and green financing, improving the capacity of ecological carbon sinks, advocating a low-carbon lifestyle among the public, strengthening international cooperation, and building a green “silk road”.
The realization of national targets relies to a large extent on regional-level emission reduction practices. For example, to reduce carbon intensity by 18%, as proposed in the 13th FYP, various provincial targets at different administrative levels were set (Supplementary Table 2). Accordingly, provinces might formulate specific implementation plans, as well as their own targets of reducing energy intensity and increasing the share of non-fossil energy consumption. Furthermore, each province could specifically allocate its reduction targets to each of its cities. Through each city’s respective efforts to decarbonize, the carbon intensity reduction target of each province and, by extension, the country’s target, can be fully achieved.
Measuring success and progress
2020 marked the end of several national targets for emission control, namely the NAMAs (which aimed to reduce carbon intensity by 40–45% relative to 2005 levels) and the 13th FYP (which aimed to reduce energy intensity and carbon intensity by 15% and 18%, respectively, relative to 2015 levels) (Table 1). In 2020, the Chinese government announced that the NAMAs target had been achieved, and achieved in advance: as of 2019, carbon intensity had been cut by 48.1% relative to the 2005 level, increasing to 48.4% as of 2020, thus exceeding the 40–45% target. In 2020, the share of non-fossil energy reached 15.9% in primary energy consumption, also meeting that objective (Fig. 4).

Timeline of China’s targets (light blue) and achievements (dark blue) for carbon intensity reduction (bars) and non-fossil energy share (circles). See also Table 1 for achievements. China has achieved almost all of the decarbonization targets it has set.
Similarly, several targets for the 13th FYP (2016–2020) were also met. As of 2020, carbon intensity was cut by 18.8% relative to 2015 level, exceeding the 18% target; the share of non-fossil consumption to the total primary energy consumption increased to 15.9%, exceeding the 15% target; and the targets of increasing forest cover and forest stock volume were also achieved (Fig. 4).
At the provincial level, most provinces successfully decreased their carbon intensity year by year, as specified by the 13th FYP, in some cases achieving and even exceeding the targets (Fig. 5). For example, as of 2020, Jiangsu had reduced its carbon intensity by 24% relative to 2015 levels, exceeding the objective of 20.5% to be achieved by 2020. Similarly, carbon intensity in Yunnan fell by 25% by 2020 compared to 2015 levels, ahead of its target of 18% by 2020. These provinces, along with other more economically developed regions, such as Beijing, were already on a downward trajectory in terms of their total emissions, indicating a possible emissions peak.

Colours represent carbon intensity reduction targets of −20.5% (blue), −19.5% (green), −18% (red), −17% (pink), −12% (magenta), as set in provincial 13th FYP (2015–2020). Labels denote the provincial achievements of carbon intensity reduction from government reports (see Supplementary Table 2). Labels with no shading denote the achievements as of 2020, while grey shading denote the achievements as of 2019, and a darker grey for 2018. Data of carbon intensity trend are collected from the IPE12, which are originally from the China City Greenhouse Gas Working Group; data for Tibet is not available. We note that the carbon intensity trends from IPE might be inconsistent with the official data sources. Most provinces have achieved the targets set by the central government.
However, some provinces were not able to achieve their goals, such as Inner Mongolia, where carbon intensity decreased by 14% in 2020 compared to 2015 levels, thus missing the target of −17% (Fig. 5). Inner Mongolia reflects provinces with energy-intensive industry, acting as an energy base for the entire nation. They therefore face greater challenges in achieving targets, illustrating the need to co-ordinate bottom-up efforts that achieve emissions objectives while taking into account differential regional development.
Successfully achieving the 2020 carbon intensity target ahead of schedule can be attributed to the strong implementation of measures on climate change mitigation. Increasing capacity, improving energy efficiency per unit production in the production process, and deploying and transforming low-carbon technologies all helped reduce carbon intensity per unit of economic output. Together with an increase in non-fossil energy, these changes decreased CO2 emissions per unit of GDP by 28.5% between 2005 and 2013. Over 2,500 Mt CO2 were not emitted as a result63. A change in the sectoral structure toward sectors of lower carbon intensities (for example, by transforming a manufacturing-based economy to a service-based economy) also aided in the early realization of China’s 2020 carbon intensity reduction targets.
It is important to note, however, that some actions to achieve emissions reductions targets would have promoted only a short-term response. For instance, the decommissioning of small, old and inefficient power plants nationwide is not sustainable longterm. Replacing such power plants with those that are larger and more efficient did substantially increase the total energy efficiency, but the scale-up in fossil fuel-based power generation has resulted in only a marginal reduction in energy intensity. Indeed, the majority of coal-fired power plants currently operational in China are large, modern power plants built after the mid-1990s, with a designed operation lifetime of more than 30 years64. Thus, roughly 200 coal-fired power plants are planned to be built over the next several years, which in combination with existing infrastructure, are anticipated to contribute approximately 250 Gt CO2 over their service life, half the global total65.
Carbon neutrality before 2060
As well as achieving several mitigation objectives, China has further pledged to become carbon neutral by 2060 (Table 1). Carbon neutrality refers to net-zero CO2 emissions — a balance between all anthropogenic emissions from fossil fuel combustion, industrial production processes, land-use changes and CO2 removals from land, ocean and human society (such as carbon capture, utilization and storage (CCUS)). Since China is at present the largest carbon emitter in the world, its pathway to net-zero emissions (including all greenhouse gases) will be essential in meeting the 2° C temperature limit targets outlined by the Paris Agreement. However, achieving carbon neutrality by 2060 cannot depend solely on measures adopted to meet 2020 intensity reduction targets. Instead, China must break down the lock-in of fossil fuel-based energy supply systems and develop effective negative-emission technologies. Indeed, while renewables and energy-efficiency improvements are projected to contribute approximately 75% of the cumulative emission reductions up to 2060 (refs66,67), the remaining emissions rely on offsets by negative-emission technologies (Fig. 6). Key elements in China’s carbon neutrality targets are now summarized.

Illustration of how negative emissions, renewables and improved efficiencies can reduce net emissions, and thus achieve carbon neutrality by 2060. Open circles denote the average baseline scenario emissions from five models7,66,67 (IEA Stated Policy Scenario, IPAC, CE3METL, WITCH2016 and GCAM), and the solid black circles indicate the average emissions from the same models but with the 1.5° C limit. The error bars show the max-min spread of these models. All scenario data are rescaled to the same level in 2020 and extended to 2060, based on the assumption of achieving net-zero emission in 2060. Contributions of each component are collected from the IEA World Energy Outlook’s Sustainable Development Scenario66,67, where ‘Efficiency’ denotes end-use efficiency and fossil fuel subsidies reform, and ‘Negative emission needed’ covers nuclear, CCUS and other technologies66. To achieve carbon neutrality in 2060, improved efficiencies, renewables development and a large number of negative emissions technologies are needed.
Coal phase-out
To curb the increase in its energy consumption and achieve its mid-century carbon neutrality goal, China needs to transform its economy from carbon-intensive manufacturing to a more service-based economy, to increase the share of electricity end-use of energy and to decarbonize its electricity generation68,69.
The overarching task in this energy transition is to phase out coal (and other fossil fuel) consumption as early as possible and to expand non-fossil energy supply70. The Action Plan on Prevention and Control of Air Pollution facilitated this transition in 2013, reducing coal consumption in the most developed regions (such as the Beijing, Tianjin and Hebei provinces) to improve air quality71. Moreover, in 2017, the Chinese government specifically proposed reducing coal power capacity for the first time, aiming to eliminate, suspend and postpone coal power production capacity by more than 50 GW (ref.72). This strategy was intended to prevent overcapacity and to improve energy efficiencies in coal power. If these policies, and others, are followed at current rates73,74, China’s coal power generation and carbon emissions are expected to peak by 2027 (ref.75).
However, achieving coal phase-out will require firmer actions. Indeed, coal power installed capacity continues to increase, owing to growing energy demand. In 2020, for example, China commissioned 76% (38.4 GW) and retired 23% (8.6 GW) of global new coal plants, leading to a net 29.8 GW increase in its coal fleet76. Moreover, the construction of 210 new coal projects in 2015 following the decentralization of power plant approval77, the fact that most existing coal-fired power plants have been put into operation in the past 15 years78 and the approval of coal projects to boost economic growth following the COVID-19 pandemic all provide additional challenges to be met before China’s coal consumption and emissions can peak. If there is any future for coal-fired power plants in China, they will probably have to be retrofitted with CCUS.
According to the China Electricity Council, however, China is still striving to reach peak installed coal capacity by 2030, representing around 1,300 GW. Although this is in line with the 2030 goal of achieving peak carbon emissions, its achievement will necessitate rapid coal phase-out thereafter. These changes are consistent with government commitments to control coal-fired power generation projects and to limit the increase in coal consumption during the 14th and 15th FYPs. Nevertheless, targets for coal power installed capacity have not yet been set officially, either during the 14th FYP nor by 2030.
Non-fossil energy development
With this reduction in fossil-derived energy comes the need for a corresponding increase in renewable energy to meet growing energy demands. Indeed, by 2020, the share of coal power installed capacity dropped below 50% for the first time79. During the 13th FYP, non-fossil energy installed capacity grew at an average annual rate of 13.1%79, allowing the targets of 15% non-fossil energy to be met (Table 1). With continued increases, China is also on the path to deliver the 25% target set up for 2030 (ref.73).
Achieving carbon neutrality, however, means that non-fossil fuel must account for 85% of the energy mix by 2050 (ref.80). Thus, renewables are at the core of the transition to carbon neutrality, given their vast resource potential81,82,83, low or no carbon emissions and declining costs. China aims to increase its wind and solar installed power generation capacity to over 1,200 GW by 2030 (ref.84), requiring a compound annual growth rate of around 10%79. Furthermore, China requires 1500–2600 GW wind capacity and 2200–2800 GW of solar capacity by 2050 to help achieve the Paris Agreement, roughly ten times the 2020 capacity85,86. Such a large-scale expansion of renewable energy necessitates fundamental changes in energy infrastructure, such as storage and transmissions, and calls for the energy market to integrate high penetration of renewables with grids.
Nuclear power might therefore form the basis of the required non-fossil energy development. In 2007, China released its Nuclear Power Medium- and Long-Term Development Plan (2005–2020), aiming to increase nuclear power generation installed capacity to 58 GW by 2020, although only 50 GW has been achieved79. As outlined by the 14th FYP, another 20 GW installed capacity of nuclear power generation will be put into operation, consistent with the target of 70 GW by 2025 (ref.87). By 2050, nuclear power generation is estimated to contribute 120–500 GW (refs86,88). This large range creates a huge gap that otherwise will need to be filled by solar, wind or CCUS in a low nuclear scenario85,89,90.
The pathways towards achieving the carbon peak and neutrality goals is complicated by the combined effects of technology, resources, cost, policy and market competition. For example, the cost of renewables and storage has declined markedly. If this trend continues, 62% of China’s electricity could come from non-fossil sources by 2030 at an 11% lower cost compared with a business-as-usual approach91. Furthermore, different transition pathways deliver similar carbon mitigation results, but could have different implications on the energy economy, on water and land resources92,93, and potentially on environmental pollution and human health94,95. Sectors that consume energy, such as the building96, transport97 and industry98 sectors also have a crucial role in filling the carbon mitigation gap. As such, adoption of technology, changes in human behaviour and policy measures that increase energy efficiency and restrain demand are equally important at the other side of the transition to clean energy.
Negative-emission technology
In addition to expanded renewables and improved energy efficiencies, negative emissions (removing CO2 from the atmosphere)99 will also be needed to achieve carbon neutrality in 2060. Specifically, negative emissions are expected to contribute nearly 25% of total emissions reduction from 2020 to 2060 (Fig. 6).
Afforestation
Afforestation is a negative-emission technology that has been widely utilized in China. Indeed, efforts to expand afforestation have made it the largest contributor (42%) of the observed global greening trend100. During the 1980s and 1990s, the net terrestrial sink in China was about 0.19–0.26 Pg C per year (around 0.7–1.0 Gt CO2 per year), offsetting around 28–37% of China’s anthropogenic CO2 emissions in same period101. By 2010–2016, however, these terrestrial sinks reached 1.11 ± 0.38 Pg C per year (about 4.0 ± 1.4 Gt CO2 per year), accounting for nearly 45% of anthropogenic emissions102. Further afforestation could be achieved by preserving and expanding forest cover, especially in areas that are suffering from desertification103.
However, owing to the fact that afforestation-related emissions reductions last only as long as the planted trees are growing, this strategy presents greater risks than a strategy that focuses more on gross reduction cuts. Under these circumstances, advanced water resource management and treatment technologies, along with precision agriculture and land-use management, could be deployed to ensure that most, or all, of the increased biomass in the afforested areas is preserved indefinitely103. In particular, commercial and residential land occupation would need to be limited. By doing so, China’s forest biomass carbon stock could increase by more than 50% by the 2050s104,105,106.
Blue carbon
China’s seas also have huge carbon sink potential (so-called “blue carbon”), providing ample opportunities to implement a variety of negative-emission technologies. For example, in coastal zones, the organic carbon storage of mangroves, salt marshes and seagrass beds is 1.3 Mt CO2 per year107. Carbon sinks in open seas are much larger, with preliminary estimates suggesting that sedimentary organic carbon storage in marginal seas of China’s coastal shelf is 75.1 Mt CO2 per year and that primary productivity of large-scale culture algae in China is approximately 12.9 Mt CO2 per year107. In addition, artificial upwelling projects could help to increase carbon sequestration in breeding areas by 0.3 Mt CO2 per year107. Overall, the amount of carbon stored in and exported to China’s seas is over 300 Mt CO2 per year107. More efforts are called to increase these oceanic sinks, such as by alleviating offshore eutrophication by reducing the use of inorganic fertilizers on land, enhancing ocean alkalinization, and by upgrading mariculture areas by artificial upwelling107.
Other negative-emission technologies
CCUS also offers one of the most important technologies for negative emissions, despite concerns regarding costs, technical challenges and actual contributions to climate mitigation108,109,110,111. For example, the potential capacity for CO2 storage in China is estimated to be 1,800 to 3,000 Gt CO2 (refs112,113), hundreds of times higher than current annual CO2 emissions (about 10 Gt CO2). Accordingly, China has started promoting CCUS trials since the 12th FYP. These include three commercial carbon capture and storage (CCS) facilities in operation (out of 26 worldwide), with an annual maximum capture capacity of around 0.82 Mt CO2, accounting for approximately 2% of global CCS storage113. A further three commercial CCS facilities are also under construction or in early development, and are expected to increase the capture capacity by around 1.8 Mt CO2 per year113, as are 13 pilot and demonstration CCS facilities114.
We note, however, that current CCS facilities are capturing CO2 emissions from fossil fuel combustion (such as coal-fired power plants) or fossil/mineral process emissions (such as clinker production and numerous petrochemical processes), reducing them to a lower or even near-zero level. Negative emissions are only possible through bioenergy combustion with CCS or through other methods that capture CO2 emissions from biogenic rather than fossil sources115. Deployment of bioenergy combustion with CCS is still some way off in China116. Thus, to have a more important role in China’s carbon neutrality, CCUS technologies must be developed rapidly and both CCS and bioenergy combustion with CCS facilities need to be deployed on a large scale as soon as possible. Otherwise, the contributions of CCUS to China’s carbon neutrality before 2060 will probably be minimal.
Carbonation of cement, one of the less frequently discussed negative-emission technologies, has considerable potential for carbon uptake117,118,119,120. It is estimated to have contributed a cumulative sink of around 6.2 Gt CO2 in China from 1930 to 2019 (ref.120). Accordingly, improving the weathering of cement and other alkaline solid wastes has become one of the major ways to mitigate emissions119. Recycling construction materials will not only substantially increase the carbonation of cement materials, but also potentially reduce the energy intensity of the construction industry by 90%121. To achieve the 2060 net-zero emission target, China must therefore recycle 100% of its construction materials and industrial byproducts, ideally by 2030 (ref.121). Other CCUS technologies might also be improved through the recycling of biomass and cascade utilization of energy and materials. It is of top priority for both central government and local governments to devise and enforce the corresponding regulations and laws.
Direct air capture technology is emphasized as one of the most important negative-emission technologies, with large-scale potential of CO2 removal; these physically or chemically adsorb CO2 in the air directly122,123. However, direct air capture technology is still immature and expensive and it has not been listed as an efficient effort in any official documents in China yet.
Low-carbon cities
Cities have been the main battlefields for fighting climate change in China124,125,126,127, particularly given that over 60% of the population live in cities at present34. This population produces 85% of the national emissions128, which is anticipated to increase further with population and economic growth129,130,131. Looking at the low-carbon development map, it is critical to develop long-term city-level emission inventories and further identify the drivers of cities’ emission growth. City-level energy and emission inventories can be developed by bottom-up132,133,134,135,136,137,138 or top-down approaches139,140,141,142. Nevertheless, inadequate energy statistics, as well as incomplete sectoral and energy-type information, pose challenges in compiling city-level carbon-mitigation policies135. In addition, despite territory-based emissions within city boundaries (Scope 1 emission), cities also rely heavily on purchased electricity (Scope 2) and other relevant cross-boundary energy and material transfer (Scope 3 emission)143. Some cities might rely heavily on imported energy and products to meet their consumption, but this means that their emissions have just been transferred to other cities. For example, 70% of emissions in China’s metropolitan areas were associated with products and services that are imported from other regions144.
Region-specific CO2 emission reduction targets could be set in provinces and cities145. For example, since 2010, China has launched three batches of low-carbon development pilot projects in 80 cities and seven provinces146, outlining carbon intensity reduction targets and low-carbon development plans147, including emissions peaks by 2025 (ref.148). The development of low-carbon cities has been motivated mainly by government policies rather than by other factors such as public awareness149,150,151,152,153, including setting emission peak paths, building near-zero carbon emission zones, or establishing assessment systems for controlling emissions154. These low-carbon pilots have made substantial progress151,155, with carbon intensity decreasing in most cities156,157, including Xiamen158. However, from 2015 to 2019, only three (Kunming, Shenzhen and Wuhan) of the thirty-six typical large cities in China peaked their emissions, while the emissions from eight of them (Beijing, Foshan, Nanjing, Nantong, Qingdao, Shanghai, Wuxi and Xiamen) have plateaued159.
Green markets
Markets have a crucial role in accelerating the development and/or deployment of renewables. Given the scale of China’s “green market” and the timing of its transition to a higher-value-added economic structure, market reforms associated with environmental protection could bring tremendous change. As of 2020, China’s balance of green loans amounted to 12 trillion yuan (US$1.9 trillion), with issued green bonds of around 1.2 trillion yuan. As a result, China has become the world’s second-biggest green bond market160. In addition, investment on energy industry is projected to be 99–138 trillion yuan cumulatively from 2020 to 2050 (ref.80).
China introduced a market-based domestic carbon emission trading scheme, operating in seven pilot markets (Beijing, Shanghai, Tianjin, Chongqing, Shenzhen, Guangdong and Hubei) since 2013. The emission trading schemes in these seven pilot markets traded approximately 1.1 billion tons of CO2 in 2013, which was the second-largest emission trading scheme in the world after that of the EU. In 2016, the 8th pilot market was established in Fujian province. However, current emission trading quotas are quite small (accounting for less than 1% of the total emissions161), outlining great potential for the future.
China subsequently launched a plan for establishing a national emission trading scheme since 2017. The plan initially started in the power industry, and was planned to expand to seven major industries, making it the largest emission trading scheme worldwide162. In 2020, China’s Ministry of Ecology and Environment drafted rules for the national carbon emission trading scheme, further leading an expansion of emission trading schemes from these pilots to other regions nationwide. By 2030, the financial needs of low-carbon projects might exceed 2,000 billion yuan163. More than 400 Mt CO2 have been traded so far164, which is the world’s second-largest carbon market in terms of the quota trading volume. However, the current cap-and-trade regime is only for electricity companies. Thus, this scheme requires further development and adjustment. For example, a cap-and-trade system for the steel sector proposed in the 14th FYP is now under discussion. As a national environmental strategy, China plans to introduce more caps on other major industries that emit carbon, such as ferrous and non-ferrous metallurgy, construction, chemical production and aviation services. More importantly, a carbon credit mechanism, such as what was granted for negative carbon emissions, should be considered by the cap-and-trade system in the future, eliciting more projects on increasing carbon uptake from bottom-up actions. A successful cap-and-trade scheme requires reliable carbon data, a transparent carbon market, and fair credit allocations. A nationwide carbon market has been launched since July 2021, which still involves only power companies at present.
Summary and future perspectives
As the world’s largest emitter, China’s carbon emissions account for 28% of the global total, surpassing those of the US and Europe combined since 2012. The fastest increase in carbon emissions were observed from 2000 to 2013, followed by a brief pause in growth and a slow rebound since 2016. 80% of China’s carbon emissions are from electric power generation and industrial sources, since its rapid industrialization, urbanization and globalization are powered by a coal-dominated energy system. China has adopted a low-carbon strategy for its economic development. Efforts to save energy, to use renewable energy and to launch low-carbon pilots, especially since 2005, have facilitated low-carbon growth, thus bending the emissions curve. Indeed, with large-scale deployment of renewable power generation, particularly hydro, wind, and solar, the share of fossil fuel has reached an all-time low and coal consumption has plateaued.
In doing so, several national targets have been met: as of 2020, carbon intensity was reduced by 18.8% relative to the 2015 level, the share of non-fossil consumption as part of the total primary energy consumption was increased to 15.9%, and forest stock volume was increased to over 17.5 billion m3, exceeding the targets of 18%, 15% and 16.5 billion m3, respectively. China also plans to become carbon neutral by 2060, making the nation ready to take global leadership in economic decarbonization and global climate governance. China has the shortest time to become carbon neutral by 2060 from the carbon emission peak by 2030 (Supplementary Table 3), with the most dramatic emission reductions required. Roadmaps for China’s low-carbon development have been proposed, emphasizing the major role of the electricity sector in achieving net-zero or near-zero emissions. Several key steps were established at the national level, including carbon emission reduction targets set up in the 14th FYP, clarifying China’s future carbon emission reduction path, and formulating a green finance plan in the 14th FYP. Such strategies are incorporating economic recovery plans into cultivating green industries such as green buildings and renewables, supporting the development and promotion of green technologies, and facilitating the establishment of zero-carbon-emission zones.
Milestones in achieving the national 2060 carbon neutrality target include the following: establishing a full-scale cap-and-trade system that covers all sectors, achieving negative emissions from afforestation, recycling and CCUS; recycling 100% of construction materials and industrial byproducts; realizing the goal of a 70% or 85% non-fossil share of primary energy consumption by 2050 under the 1.5° C and 2° C temperature limit scenarios, respectively; and developing a full CCUS for the remaining fossil fuel-based boilers and plants. Concrete progress in these aspects will help to realize China’s commitment to carbon neutrality before 2060. However, understanding the trends and trajectories of carbon emissions remains challenging in the light of uncertainty about world economies and technological breakthroughs.
To achieve net-zero emissions before 2060, China needs to embrace an era of opportunities and challenges. First, its CO2 emissions must be decoupled from its economic growth. Second, given the rapid expansion of residential consumption and infrastructure investments, reducing emissions from the demand side (or consumption side) remains essential to achieving both the goal of carbon neutrality and the goal of economic growth. Third, coal is still the key energy source in China. Before achieving any breakthroughs in applying renewable energy technology at large scale, as well as the technology of utilizing coal in a clean way, China still needs to find a balance between coal phase-out, costs and energy security. Fourth, as a developing country, China still lags in terms of some technological research and innovations, posing challenges to upgrading industries and, by extension, to the adjustment of its economic structure. Breakthroughs in technologies for achieving global carbon neutrality, especially negative-emission technologies, are essential for international cooperation. Last, current efforts to reduce emissions are mainly responses to top-down policies by the central government. Measures that can incentivize bottom-up efforts more widely are called for, such as setting local mitigation targets for emission caps, perfecting the carbon trade scheme, promoting a just transition towards carbon neutrality, and mobilizing communities and society.
Meanwhile, the opportunities brought by carbon neutrality will also trigger fundamental transformations. A green path to net-zero emissions will promote sustainable and high-quality development in China, especially in the post-COVID era. Incorporating carbon neutrality into national social and economic plans will accelerate optimization and green upgrading of industrial structure and energy structures, and promote the development of new technologies for low-carbon industries. These challenges also create tremendous opportunities. Since it has the world’s largest installation capacity in wind power, solar power and hydro power, China is well positioned to be the leading manufacturer of green technologies. These capabilities could enable China to transform and upgrade its various industries and to create more employment opportunities in green industries. In addition, the realization of net-zero emissions will benefit air quality165,166 and human health167,168,169. For example, an improvement in energy intensity in the non-power industrial sector could help reduce CO2 emissions by 18–50% in China, along with a reduction of SO2, NOx and particulate matter168.
To address the challenges posed by other contributors, key areas of technology, such as energy storage, hydrogen and even fusion, are anticipated to mature at a reasonable cost in the next few decades. Meanwhile, a clear role in long-term strategies, a harmonious system of regulatory standards, and a mature commercial practice for massive secure use will be key to the large-scale application of these technologies. Digital technologies are also expected to revolutionize both the demand and the supply side of energy systems. Great challenges lie ahead in terms of social cost and political stability in the course of this dramatic transition of the energy and economic systems, which will create both winners and losers at large scale. The path to net-zero emissions will trigger profound top-down reforms in every aspect of economy and society. Research in social sciences and behavioural science has not yet given much attention to the enormous social transition that will be induced by actions towards carbon neutrality.
References
Friedlingstein, P. et al. Global Carbon Budget 2020. Earth Syst. Sci. Data 12, 3269–3340 (2020).
Guan, D. et al. Structural decline in China’s CO2 emissions through transitions in industry and energy systems. Nat. Geosci. 11, 551–555 (2018).
Jackson, R. B. et al. Reaching peak emissions. Nat. Clim. Change 6, 7–10 (2015).
Peters, G. P. et al. Key indicators to track current progress and future ambition of the Paris Agreement. Nat. Clim. Change 7, 118–122 (2017).
Liu, Z., Zheng, B. & Zhang, Q. New dynamics of energy use and CO2 emissions in China. Preprint at arXiv https://arxiv.org/abs/1811.09475 (2018).
Shan, Y., Huang, Q., Guan, D. & Hubacek, K. China CO2 emission accounts 2016–2017. Sci. Data 7, 54 (2020).
Duan, H. et al. Assessing China’s efforts to pursue the 1.5 degrees C warming limit. Science 372, 378–385 (2021).
Jiang, K., Zhuang, X., Miao, R. & He, C. China’s role in attaining the global 2° C target. Clim. Policy 13, 55–69 (2013).
Crippa, M. et al. Fossil CO2 Emissions of All World Countries — 2020 Report (Publications Office of the European Union, 2020).
Detailed CO2 estimates (Edition 2020). In IEA CO2 Emissions from Fuel Combustion Statistics: Greenhouse Gas Emissions from Energy (OECD, 2021); https://doi.org/10.1787/f7c42083-en.
Statistical Review of World Energy 2020 (BP, 2020) https://www.bp.com/content/dam/bp/business-sites/en/global/corporate/pdfs/energy-economics/statistical-review/bp-stats-review-2020-full-report.pdf.
Blue Carbon Map (IPE, 2021); http://wwwen.ipe.org.cn/MapLowCarbon/LowCarbon.html.
Qi, Y., Wu, T., He, J. & King, D. A. China’s carbon conundrum. Nat. Geosci. 6, 507–509 (2013).
Shan, Y. et al. China CO2 emission accounts 1997–2015. Sci. Data 5, 170201 (2018).
Qi, Y., Stern, N., Wu, T., Lu, J. & Green, F. China’s post-coal growth. Nat. Geosci. 9, 564–566 (2016).
Statistical Communiqué of the People’s Republic of China on the 2019 National Economic and Social Development (National Bureau of Statistics of China, 2020); http://www.stats.gov.cn/english/PressRelease/202002/t20200228_1728917.html.
Marland, G. China’s uncertain CO2 emissions. Nat. Clim. Change 2, 645–646 (2012).
Hong, C. et al. Variations of China’s emission estimates: response to uncertainties in energy statistics. Atmos. Chem. Phys. 17, 1227–1239 (2017).
Liu, Z. et al. Four system boundaries for carbon accounts. Ecol. Model. 318, 118–125 (2015).
Guan, D., Liu, Z., Geng, Y., Lindner, S. & Hubacek, K. The gigatonne gap in China’s carbon dioxide inventories. Nat. Clim. Change 2, 672–675 (2012).
Zheng, H. et al. How modifications of China’s energy data affect carbon mitigation targets. Energy Policy 116, 337–343 (2018).
Ma, B., Song, G., Zhang, L. & Sonnenfeld, D. A. Explaining sectoral discrepancies between national and provincial statistics in China. China Econ. Rev. 30, 353–369 (2014).
Feng, K. et al. Outsourcing CO2 within China. Proc. Natl Acad. Sci. USA 110, 11654–11659 (2013).
Feng, K., Siu, Y. L., Guan, D. & Hubacek, K. Analyzing drivers of regional carbon dioxide emissions for China. J. Ind. Ecol. 16, 600–611 (2012).
Liu, Z., Geng, Y., Lindner, S. & Guan, D. Uncovering China’s greenhouse gas emission from regional and sectoral perspectives. Energy 45, 1059–1068 (2012).
Zhou, Y., Shan, Y., Liu, G. & Guan, D. Emissions and low-carbon development in Guangdong-Hong Kong-Macao Greater Bay Area cities and their surroundings. Appl. Energy 228, 1683–1692 (2018).
Liu, Z. China’s carbon emissions report 2015 (Harvard Kennedy School of Government, 2015).
Liu, Z. et al. Embodied energy use in China’s industrial sectors. Energy Policy 49, 751–758 (2012).
Liu, Z. et al. Energy policy: a low-carbon road map for China. Nature 500, 143–145 (2013).
Zheng, H. et al. Regional determinants of China’s consumption-based emissions in the economic transition. Environ. Res. Lett. 15, 074001 (2020).
Guan, D., Hubacek, K., Weber, C. L., Peters, G. P. & Reiner, D. M. The drivers of Chinese CO2 emissions from 1980 to 2030. Glob. Environ. Change 18, 626–634 (2008).
Zheng, X. et al. Drivers of change in China’s energy-related CO2 emissions. Proc. Natl Acad. Sci. USA 117, 29–36 (2020).
A series of Reports on Economic and Social Development Achievements in the 40 Years of Reform and Opening up [in Chinese] (National Bureau of Statistics of China, 2018); http://www.stats.gov.cn/ztjc/ztfx/ggkf40n/201808/t20180827_1619235.html.
National Bureau of Statistics of China. National Data http://data.stats.gov.cn/english/ (2020).
Zheng, J. et al. The slowdown in China’s carbon emissions growth in the new phase of economic development. One Earth 1, 240–253 (2019).
Green, F. & Stern, N. China’s changing economy: implications for its carbon dioxide emissions. Clim. Policy 17, 423–442 (2016).
Yu, Y. & Du, Y. Impact of technological innovation on CO2 emissions and emissions trend prediction on ‘new normal’ economy in China. Atmos. Pollut. Res. 10, 152–161 (2019).
Guan, D., Peters, G. P., Weber, C. L. & Hubacek, K. Journey to world top emitter: an analysis of the driving forces of China’s recent CO2 emissions surge. Geophys. Res. Lett. 36, L04709 (2009).
Peters, G. P., Guan, D., Hubacek, K., Minx, J. C. & Weber, C. L. Effects of China’s economic growth. Science 328, 824–825 (2010).
Minx, J. C. et al. A “carbonizing dragon”: China’s fast growing CO2 emissions revisited. Env. Sci. Technol. 45, 9144–9153 (2011).
Peters, G. P. & Hertwich, E. G. CO2 embodied in international trade with implications for global climate policy. Env. Sci. Technol. 42, 1401–1407 (2008).
Mi, Z., Meng, J., Green, F., Coffman, D. M. & Guan, D. China’s “exported carbon” peak: patterns, drivers, and implications. Geophys. Res. Lett. 45, 4309–4318 (2018).
Liu, Z. et al. Targeted opportunities to address the climate–trade dilemma in China. Nat. Clim. Change 6, 201–206 (2015).
Pan, C. et al. Emissions embodied in global trade have plateaued due to structural changes in China. Earth Future 5, 934–946 (2017).
Meng, J. et al. The rise of south–south trade and its effect on global CO2 emissions. Nat. Commun. 9, 1871 (2018).
Mi, Z. et al. Chinese CO2 emission flows have reversed since the global financial crisis. Nat. Commun. 8, 1712 (2017).
Wood, R. et al. Beyond peak emission transfers: historical impacts of globalization and future impacts of climate policies on international emission transfers. Clim. Policy 20, S14–S27 (2019).
Liu, Z. et al. Embodied carbon emissions in China–US trade. Sci. China Earth Sci. 63, 1577–1586 (2020).
Mi, Z. et al. Pattern changes in determinants of Chinese emissions. Environ. Res. Lett. 12, 074003 (2017).
Peters, G. P. et al. Rapid growth in CO2 emissions after the 2008–2009 global financial crisis. Nat. Clim. Change 2, 2–4 (2011).
Friedlingstein, P. et al. Persistent growth of CO2 emissions and implications for reaching climate targets. Nat. Geosci. 7, 709–715 (2014).
Sadorsky, P. Energy related CO2 emissions before and after the financial crisis. Sustainability 12, 3867 (2020).
Shearer, C., Yu, A., & Nace, T. Tsunami Warning: Can China’s Central Authorities Stop a Massive Surge in New Coal Plants Caused by Provincial Overpermitting? (CoalSwarm, 2018); https://endcoal.org/2018/09/tsunami-warning/.
The State Council of the People’s Republic of China. Report on the Work of the Government (ENGLISH.GOV.CN, 2020); http://english.www.gov.cn/premier/news/202005/30/content_WS5ed197f3c6d0b3f0e94990da.html.
Liu, Z., Ciais, P., Deng, Z. et al. Near-real-time monitoring of global CO2 emissions reveals the effects of the COVID-19 pandemic. Nat. Commun. 11, 5172 (2020).
Maraseni, T. K., Qu, J., Zeng, J. & Liu, L. An analysis of magnitudes and trends of household carbon emissions in China between 1995 and 2011. Int. J. Environ. Res. 10, 179–192 (2016).
Cai, B., Li, W., Dhakal, S. & Wang, J. Source data supported high resolution carbon emissions inventory for urban areas of the Beijing–Tianjin–Hebei region: spatial patterns, decomposition and policy implications. J. Environ. Manage. 206, 786–799 (2018).
Li, Y., Zhao, R., Liu, T. & Zhao, J. Does urbanization lead to more direct and indirect household carbon dioxide emissions? Evidence from China during 1996–2012. J. Clean. Prod. 102, 103–114 (2015).
Mi, Z. et al. Economic development and converging household carbon footprints in China. Nat. Sustain. 3, 529–537 (2020).
Wiedenhofer, D. et al. Unequal household carbon footprints in China. Nat. Clim. Change 7, 75–80 (2016).
Yuan, R., Rodrigues, J. F. D. & Behrens, P. Driving forces of household carbon emissions in China: a spatial decomposition analysis. J. Clean. Prod. 233, 932–945 (2019).
Mi, Z. et al. China’s energy consumption in the new normal. Earth Future 6, 1007–1016 (2018).
Zhang Gaoli Attends UN Climate Summit and Delivers Speech (Ministry of Foreign Affairs of the People’s Republic of China, 2014); https://www.fmprc.gov.cn/mfa_eng/zxxx_662805/t1194544.shtml.
Cui, R. et al. A High Ambition Coal Phaseout in China: Feasible Strategies Through a Comprehensive Plant-by-plant Assessment (Center for Global Sustainability, 2020); https://cgs.umd.edu/sites/default/files/2020-01/1.13.2020_AHighAmbitionCoalPhaseoutInChina_EN_fullreport%20.pdf.
Tong, D. et al. Committed emissions from existing energy infrastructure jeopardize 1.5 degrees C climate target. Nature 572, 373–377 (2019).
CO2 Emissions Reductions in China, 2015–2060 by Scenario (IEA, 2020); https://www.iea.org/data-and-statistics/charts/co2-emissions-reductions-in-china-2015-2060-by-scenario (2020).
World Energy Outlook 2020 (IEA, 2020); https://www.iea.org/reports/world-energy-outlook-2020.
Renewables 2020 Global Status Report (REN21, 2020); https://www.ren21.net/gsr-2020/ (2020).
China Electricity Industry Statistic Bulletin 2019 [in Chinese] (CEC, 2020); https://www.cec.org.cn/upload/1/editor/1579576517375.pdf.
He, G. et al. Enabling a rapid and just transition away from coal in China. One Earth 3, 187–194 (2020).
The State Council Issues Action Plan on Prevention and Control of Air Pollution Introducing Ten Measures to Improve Air Quality (Ministry of Ecology and Environment of the People’s Republic of China, 2013); http://english.mee.gov.cn/News_service/infocus/201309/t20130924_260707.shtml.
Report on the Work of the Government (The State Council of the People’s Republic of China, 2017); http://english.www.gov.cn/premier/news/2017/03/16/content_281475597911192.htm.
Energy Production and Consumption Revolution Strategy (2016–2030) [in Chinese] (NDRC, 2017); https://www.ndrc.gov.cn/xxgk/zcfb/tz/201704/t20170425_962953.html.
13th Five-year Plan for Energy Development of the People’s Republic of China. [in Chinese] (NDRC, 2017); https://www.ndrc.gov.cn/fggz/fzzlgh/gjjzxgh/201705/t20170517_1196766.html.
New Energy Outlook 2019 (BNEF, 2019); https://about.bnef.com/new-energy-outlook/.
Shearer, C. & Myllyvirta, L. China Dominates 2020 Coal Development (Global Energy Monitor, 2021).
Myllyvirta, L., Shen, X. & Lammi, H. Is China Doubling Down on its Coal Power Bubble? (Greenpeace East Asia, 2016).
Cui, R. Y. et al. A plant-by-plant strategy for high-ambition coal power phaseout in China. Nat. Commun. 12, 1468 (2021).
Analysis and Forecast of China Power Demand-supply Situation 2020–2021 (CEC. 2021); https://english.cec.org.cn/detail/index.html?3-1128.
He, J. et al. Comprehensive report on China’s long-term low-carbon development strategies and pathways. Chin. J. Popul. Resour. Environ. 18, 263–295 (2020).
He, G. & Kammen, D. M. Where, when and how much wind is available? A provincial-scale wind resource assessment for China. Energy Policy 74, 116–122 (2014).
He, G. & Kammen, D. M. Where, when and how much solar is available? A provincial-scale solar resource assessment for China. Renew. Energy 85, 74–82 (2016).
McElroy, M. B., Lu, X., Nielsen, C. P. & Wang, Y. Potential for wind-generated electricity in China. Science 325, 1378–1380 (2009).
Xinhuanet. Remarks by Chinese President Xi Jinping at Climate Ambition Summit. Xinhuanet http://www.xinhuanet.com/english/2020-12/12/c_139584803.htm (2020).
Jiang, K., He, C., Dai, H., Liu, J. & Xu, X. Emission scenario analysis for China under the global 1.5°C target. Carbon Manag. 9, 481–491 (2018).
Zhongying, W. & Sandholt, K. Thoughts on China’s energy transition outlook. Energy Transit. 3, 59–72 (2019).
Outline of the 14th Five-year Plan (2021–2025) for National Economic and Social Development and Vision 2035 of the People’s Republic of China [in Chinese] (The State Council of the People’s Republic of China, 2021); http://www.gov.cn/xinwen/2021-03/13/content_5592681.htm.
Chen, Y. et al. Prospects in China for nuclear development up to 2050. Prog. Nucl. Energy 103, 81–90 (2018).
He, G. et al. SWITCH-China: a systems approach to decarbonizing China’s power system. Env. Sci. Technol. 50, 5467–5473 (2016).
Yu, S. et al. CCUS in China’s mitigation strategy: insights from integrated assessment modeling. Int. J. Greenh. Gas. Control. 84, 204–218 (2019).
He, G. et al. Rapid cost decrease of renewables and storage accelerates the decarbonization of China’s power system. Nat. Commun. 11, 2486 (2020).
Zhang, C. et al. Virtual scarce water embodied in inter-provincial electricity transmission in China. Appl. Energy 187, 438–448 (2017).
Zhang, C., Zhong, L. & Wang, J. Decoupling between water use and thermoelectric power generation growth in China. Nat. Energy 3, 792–799 (2018).
Yang, Y. et al. Mapping global carbon footprint in China. Nat. Commun. 11, 2237 (2020).
Peng, W., Yang, J., Lu, X. & Mauzerall, D. L. Potential co-benefits of electrification for air quality, health, and CO2 mitigation in 2030 China. Appl. Energy 218, 511–519 (2018).
Zhou, N., Khanna, N., Feng, W., Ke, J. & Levine, M. Scenarios of energy efficiency and CO2 emissions reduction potential in the buildings sector in China to year 2050. Nat. Energy 3, 978–984 (2018).
Wang, H., Ou, X. & Zhang, X. Mode, technology, energy consumption, and resulting CO2 emissions in China’s transport sector up to 2050. Energy Policy 109, 719–733 (2017).
Rissman, J. et al. Technologies and policies to decarbonize global industry: Review and assessment of mitigation drivers through 2070. Appl. Energy 266, 114848 (2020).
Minx, J. C. et al. Negative emissions — part 1: research landscape and synthesis. Environ. Res. Lett. 13, 063001 (2018).
Piao, S. et al. Characteristics, drivers and feedbacks of global greening. Nat. Rev. Earth Environ. 1, 14–27 (2019).
Piao, S. et al. The carbon balance of terrestrial ecosystems in China. Nature 458, 1009–1013 (2009).
Wang, J. et al. Large Chinese land carbon sink estimated from atmospheric carbon dioxide data. Nature 586, 720–723 (2020).
Lian, X. et al. Multifaceted characteristics of dryland aridity changes in a warming world. Nat. Rev. Earth Environ. 2, 232–250 (2021).
Hu, H., Wang, S., Guo, Z., Xu, B. & Fang, J. The stage-classified matrix models project a significant increase in biomass carbon stocks in China’s forests between 2005 and 2050. Sci. Rep. 5, 11203 (2015).
Qiu, Z., Feng, Z., Song, Y., Li, M. & Zhang, P. Carbon sequestration potential of forest vegetation in China from 2003 to 2050: predicting forest vegetation growth based on climate and the environment. J. Clean. Prod. 252, 119715 (2020).
Zhang, H., Feng, Z., Chen, P. & Chen, X. Development of a tree growth difference equation and its application in forecasting the biomass carbon stocks of chinese forests in 2050. Forests 10, 582 (2019).
Jiao, N. Developing ocean negative carbon emission technology to support national carbon neutralization [in Chinese]. Bull. Chin. Acad. Sci. 36, 179–187 (2021).
Chalmers, H. Fundamentals point to carbon capture. Nat. Clim. Change 9, 348–348 (2019).
Mac Dowell, N., Fennell, P. S., Shah, N. & Maitland, G. C. The role of CO2 capture and utilization in mitigating climate change. Nat. Clim. Change 7, 243–249 (2017).
Jiang, K. et al. China’s carbon capture, utilization and storage (CCUS) policy: a critical review. Renew. Sustain. Energy Rev. 119, 109601 (2020).
Liu, H. J., Were, P., Li, Q., Gou, Y. & Hou, Z. Worldwide status of CCUS technologies and their development and challenges in China. Geofluids 2017, 1–25 (2017).
Sun, L., Dou, H., Li, Z., Hu, Y. & Hao, X. Assessment of CO2 storage potential and carbon capture, utilization and storage prospect in China. J. Energy Inst. 91, 970–977 (2018).
Global CCS Institute. The global status of CCS report 2020 (Global CCS Institute, 2020).
Global CCS Institute. CCS Facilities Database (CO2RE, 2019); https://co2re.co/FacilityData.
Fuss, S. et al. Betting on negative emissions. Nat. Clim. Change 4, 850–853 (2014).
Huang, X., Chang, S., Zheng, D. & Zhang, X. The role of BECCS in deep decarbonization of China’s economy: a computable general equilibrium analysis. Energy Econ. 92, 104968 (2020).
Xi, F. et al. Substantial global carbon uptake by cement carbonation. Nat. Geosci. 9, 880–883 (2016).
Skocek, J., Zajac, M. & Ben Haha, M. Carbon capture and utilization by mineralization of cement pastes derived from recycled concrete. Sci. Rep. 10, 5614 (2020).
Habert, G. et al. Environmental impacts and decarbonization strategies in the cement and concrete industries. Nat. Rev. Earth Environ. 1, 559–573 (2020).
Guo, R. et al. Global CO2 uptake by cement from 1930 to 2019. Earth Syst. Sci. Data 13, 1791–1805 (2021).
Churkina, G. et al. Buildings as a global carbon sink. Nat. Sustain. 3, 269–276 (2020).
Hanna, R., Abdulla, A., Xu, Y. & Victor, D. G. Emergency deployment of direct air capture as a response to the climate crisis. Nat. Commun. 12, 368 (2021).
McQueen, N. et al. A review of direct air capture (DAC): scaling up commercial technologies and innovating for the future. Prog. Energy 3, 032001 (2021).
Lee, C. M. & Erickson, P. How does local economic development in cities affect global GHG emissions? Sustain. Cities Soc. 35, 626–636 (2017).
Sugar, L., Kennedy, C. & Leman, E. Greenhouse gas emissions from Chinese cities. J. Ind. Ecol. 16, 552–563 (2012).
Grimm, N. B. et al. Global change and the ecology of cities. Science 319, 756–760 (2008).
Rosenzweig, C., Solecki, W., Hammer, S. A. & Mehrotra, S. Cities lead the way in climate-change action. Nature 467, 909–911 (2010).
Shan, Y. et al. City-level climate change mitigation in China. Sci. Adv. 4, eaaq0390 (2018).
Wang, R., Zheng, X., Wang, H. & Shan, Y. Emission drivers of cities at different industrialization phases in China. J. Env. Manage. 250, 109494 (2019).
Jia, J., Gong, Z., Xie, D., Chen, J. & Chen, C. Analysis of drivers and policy implications of carbon dioxide emissions of industrial energy consumption in an underdeveloped city: the case of Nanchang, China. J. Clean. Prod. 183, 843–857 (2018).
Li, B., Liu, X. & Li, Z. Using the STIRPAT model to explore the factors driving regional CO2 emissions: a case of Tianjin, China. Nat. Hazards 76, 1667–1685 (2015).
Miao, L. Examining the impact factors of urban residential energy consumption and CO2 emissions in China — evidence from city-level data. Ecol. Indic. 73, 29–37 (2017).
Jing, Q., Bai, H., Luo, W., Cai, B. & Xu, H. A top-bottom method for city-scale energy-related CO2 emissions estimation: a case study of 41 Chinese cities. J. Clean. Prod. 202, 444–455 (2018).
Cai, B., Guo, H., Cao, L., Guan, D. & Bai, H. Local strategies for China’s carbon mitigation: an investigation of Chinese city-level CO2 emissions. J. Clean. Prod. 178, 890–902 (2018).
Cai, B. et al. China city-level greenhouse gas emissions inventory in 2015 and uncertainty analysis. Appl. Energy 253, 113579 (2019).
Shan, Y. et al. Methodology and applications of city level CO2 emission accounts in China. J. Clean. Prod. 161, 1215–1225 (2017).
Shan, Y., Liu, J., Liu, Z., Shao, S. & Guan, D. An emissions–socioeconomic inventory of Chinese cities. Sci. Data 6, 190027 (2019).
Liu, Z. & Cai, B. High-resolution Carbon Emissions Data for Chinese Cities (Environment and Natural Resources Program, Belfer Center, 2018); https://www.belfercenter.org/publication/high-resolution-carbon-emissions-datachinese-cities.
Su, Y. et al. China’s 19-year city-level carbon emissions of energy consumptions, driving forces and regionalized mitigation guidelines. Renew. Sustain. Energy Rev. 35, 231–243 (2014).
Zheng, J. et al. Regional development and carbon emissions in China. Energy Econ. 81, 25–36 (2019).
Wang, S. & Liu, X. China’s city-level energy-related CO2 emissions: spatiotemporal patterns and driving forces. Appl. Energy 200, 204–214 (2017).
Zheng, B. et al. Observing carbon dioxide emissions over China’s cities and industrial areas with the Orbiting Carbon Observatory-2. Atmos. Chem. Phys. 20, 8501–8510 (2020).
Chen, G. et al. Review on city-level carbon accounting. Env. Sci. Technol. 53, 5545–5558 (2019).
Mi, Z. et al. Consumption-based emission accounting for Chinese cities. Appl. Energy 184, 1073–1081 (2016).
He, J.-K. An analysis of China’s CO2 emission peaking target and pathways. Adv. Clim. Change Res. 5, 155–161 (2014).
Document for Implementation of Low-carbon Development in Cities and Provinces [in Chinese] (NDRC, 2010); https://www.ndrc.gov.cn/xxgk/zcfb/tz/201008/t20100810_964674.html.
Government of China. The People’s Republic of China Second Biennial Update Report on Climate Change (UNFCCC, 2018); https://unfccc.int/documents/197666.
Qi, Y. T. L., Song, Q., Wang, Y. & Lv, J. Low-carbon city pilot: leading the carbon emissions peak in the 14th five-year plan period. [in Chinese] Environ. Prot. 48, 9–11, (2020).
Liu, W. & Qin, B. Low-carbon city initiatives in China: a review from the policy paradigm perspective. Cities 51, 131–138 (2016).
Mao, Q., Ma, B., Wang, H. & Bian, Q. Investigating policy instrument adoption in low-carbon city development: a case study from China. Energies 12, 3475 (2019).
Hunter, G. W., Sagoe, G., Vettorato, D. & Jiayu, D. Sustainability of low carbon city initiatives in China: a comprehensive literature review. Sustainability 11, 4342 (2019).
Cai, B. et al. How scholars and the public perceive a “low carbon city” in China. J. Clean. Prod. 149, 502–510 (2017).
Zhao, Z.-Y., Gao, L. & Zuo, J. How national policies facilitate low carbon city development: a China study. J. Clean. Prod. 234, 743–754 (2019).
China’s Policies and Actions for Addressing Climate Change 2018 (Ministry of Ecology and Environment of People’s Republic of China, 2018); http://english.mee.gov.cn/News_service/news_release/201812/P020181203536441502157.pdf.
Khanna, N., Fridley, D. & Hong, L. China’s pilot low-carbon city initiative: a comparative assessment of national goals and local plans. Sustain. Cities Soc. 12, 110–121 (2014).
Li, H., Wang, J., Yang, X., Wang, Y. & Wu, T. A holistic overview of the progress of China’s low-carbon city pilots. Sustain. Cities Soc. 42, 289–300 (2018).
Yang, X., Wang, X.-C. & Zhou, Z.-Y. Development path of Chinese low-carbon cities based on index evaluation. Adv. Clim. Change Res. 9, 144–153 (2018).
Shi, L., Xiang, X., Zhu, W. & Gao, L. Standardization of the evaluation index system for low-carbon cities in China: a case study of Xiamen. Sustainability 10, 3751 (2018).
Jiang, H. et al. Study on peak CO2 emissions of typical large cities in China. Clim. Change Res. 17, 131-139 (2021).
Responding to Climate Change: China’s Policies and Actions (The State Council Information Office of the People’s Republic of China, 2021); http://www.scio.gov.cn/zfbps/32832/Document/1715506/1715506.htm.
Guan, D., Shan, Y., Liu, Z. & He, K. Performance assessment and outlook of China’s emission-trading scheme. Engineering 2, 398–401 (2016).
China’s Emissions Trading Scheme (IEA, 2020); https://www.iea.org/reports/chinas-emissions-trading-scheme.
Chen Bo, W. Y. E3G Report — China’s Low Carbon Finance and Investment Pathway (E3G, 2014); http://www.e3g.org/news/media-room/chinas-green-credit-policy-agenda-provides-the-basis-for-financing-a-low-ca.
The Regular Press Conference of the Ministry of Ecology and Environment in October [in Chinese] (Ministry of Ecology and Environment of the People’s Republic of China, 2020); http://www.mee.gov.cn/xxgk2018/xxgk/xxgk15/202010/t20201028_805298.html.
West, J. J. et al. Co-benefits of global greenhouse gas mitigation for future air quality and human health. Nat. Clim. Chang. 3, 885–889 (2013).
Rao, S. et al. A multi-model assessment of the co-benefits of climate mitigation for global air quality. Environ. Res. Lett. 11, 124013 (2016).
Xie, Y. et al. Co-benefits of climate mitigation on air quality and human health in Asian countries. Env. Int. 119, 309–318 (2018).
Qian, H. et al. Air pollution reduction and climate co-benefits in China’s industries. Nat. Sustain. 4, 417–425 (2021).
Li, M., Zhang, D., Li, C.-T., Selin, N. E. & Karplus, V. J. Co-benefits of China’s climate policy for air quality and human health in China and transboundary regions in 2030. Environ. Res. Lett. 14, 084006 (2019).
Outline of the National 10th Five-year Plan [in Chinese] (The State Council of the People’s Republic of China, 2021); http://www.gov.cn/gongbao/content/2001/content_60699.htm.
Outline of the National 11th Five-year Plan [in Chinese] (The State Council of the People’s Republic of China, 2006); http://www.gov.cn/gongbao/content/2006/content_268766.htm.
Outline of the National 12th Five-year Plan [in Chinese] (The State Council of the People’s Republic of China, 2011); http://www.gov.cn/2011lh/content_1825838.htm.
China’s National Climate Change Programme [in Chinese] (National Development and Reform Commission (NDRC) of the People’s Republic of China, 2007); https://www.ndrc.gov.cn/xwdt/xwfb/200706/t20070604_957690.html.
Government of China. The People’s Republic of China Third National Communication on Climate Change (UNFCCC, 2018); https://unfccc.int/documents/197660.
General Office of the State Council. Decision of Targets for Controlling Greenhouse Gas Emission by the Standing Committee of the State Council. [in Chinese] (The Central People’s Government of the People’s Republic of China, 2009); http://www.gov.cn/ldhd/2009-11/26/content_1474016.htm.
Economic Daily. The Forest Cover Reached 23.04% Achieving the 13th FYP Target. [in Chinese] (The State Council of the People’s Republic of China, 2021); http://www.gov.cn/xinwen/2020-12/18/content_5570486.htm.
Enhanced Actions on Climate Change: China’s Intended Nationally Determined Contributions [in Chinese] (The State Council of the People’s Republic of China, 2015); http://www.gov.cn/xinwen/2015-06/30/content_2887330.htm.
The State Council of the People’s Republic of China. Outline of the National 13th Five-year Plan. [in Chinese] (Government of China, 2016); http://www.gov.cn/xinwen/2016-03/17/content_5054992.htm.
‘Enhance Solidarity’ to Fight COVID-19, Chinese President Urges, also Pledges Carbon Neutrality by 2060 (UN, 2020); https://news.un.org/en/story/2020/09/1073052.
Government of China. China’s Achievements, New Goals and New Measures for Nationally Determined Contributions (UNFCCC, 2021); https://www4.unfccc.int/sites/ndcstaging/PublishedDocuments/China%20First/China%E2%80%99s%20Achievements,%20New%20Goals%20and%20New%20Measures%20for%20Nationally%20Determined%20Contributions.pdf.
Country Emissions (GCA, 2020); http://www.globalcarbonatlas.org/en/CO2-emissions.
Gilfillan, D. & Marland, G. CDIAC-FF: global and national CO2 emissions from fossil fuel combustion and cement manufacture: 1751–2017. Earth Syst. Sci. Data 13, 1667–1680 (2021).
Government of China. The People’s Republic of China Initial National Communication on Climate Change (UNFCCC, 2004); https://unfccc.int/documents/71494.
Government of China. Second National Communication on Climate Change of The People’s Republic of China (UNFCCC, 2012); https://unfccc.int/documents/71515.
Government of China. The People’s Republic of China First Biennial Update Report on Climate Change (UNFCCC, 2016); https://unfccc.int/documents/180618.
Crude Steel Production (World Steel Association, 2021); https://www.worldsteel.org/steel-by-topic/statistics/steel-data-viewer.html.
Andrew, R.M., 2018. Global CO2 emissions from cement production. Earth Syst. Sci. Data 195–217 (2018).
Zhou, X. (eds) China Electric Power Yearbook 2002 (Chinese Edition) (Beijing: China Electric Power Press, 2002).
Andres, R. J. et al. A synthesis of carbon dioxide emissions from fossil-fuel combustion. Biogeosciences 9, 1845–1871 (2012).
Gregg, J. S., Andres, R. J. & Marland, G. China: emissions pattern of the world leader in CO2 emissions from fossil fuel consumption and cement production. Geophys. Res. Lett. 35, L08806 (2008).
Andres, R. J., Boden, T. A. & Higdon, D. A new evaluation of the uncertainty associated with CDIAC estimates of fossil fuel carbon dioxide emission. Tellus B 66, 23616 (2014).
Olivier, J. G., Janssens-Maenhout, G. & Peters, J. A. Trends in global CO2 emissions: 2012 report (PBL Netherlands Environmental Assessment Agency, 2012).
Le Quéré, C. et al. Global carbon budget 2014. Earth Syst. Sci. Data Discuss. 7, 521–610 (2014).
Research Team of China Climate Change Country Study. China Climate Change Country Study (Beijing:Tsinghua Univ. Press, 1999).
Boden, T. A., Marland, G. & Andres, R. J. Global, regional, and national fossil-fuel CO2 emissions (Oak Ridge National Laboratory, US Department of Energy, 2013).
Fridley, D., Levine, M., Lu, H. & Fino-Chen, C. Key China Energy Statistics 2014 (Lawrence Berkeley National Laboratory, 2014).
Revised 1996 IPCC Guidelines for National Greenhouse Gas Inventories (IPCC, 1997).
2006 IPCC Guidelines for National Greenhouse Gas Inventories (IPCC, 2006).
National Bureau of Statistics of China. Chinese Energy Statistics Yearbook 2013 (China Statistics Press, 2013).
Sinton, J. E. & Fridley, D. G. A guide to China’s energy statistics. J. Energy Lit. 8, 22–35 (2002).
Acknowledgements
The authors thank Z.L. Ding and J.K. He for insightful comments and suggestions. Authors acknowledge the National Natural Science Foundation of China (grant 41921005 and 71874097), Beijing Natural Science Foundation (JQ19032), and the Qiu Shi Science & Technologies Foundation.
Author information
Authors and Affiliations
Contributions
Z.L. designed the manuscript. Z.L., Z.D., G.H., H.W., X.Z., J.L. and Y.Q. contributed to the literature review, and the writing and editing of the article.
Corresponding author
Ethics declarations
Competing interests
The authors declare no competing interests.
Additional information
Peer review information
Nature Reviews Earth & Environment thanks Ryna Yiyun Cui and the other, anonymous, reviewer(s) for their contribution to the peer review of this work.
Publisher’s note
Springer Nature remains neutral with regard to jurisdictional claims in published maps and institutional affiliations.
Supplementary information
Rights and permissions
About this article

Cite this article
Liu, Z., Deng, Z., He, G. et al. Challenges and opportunities for carbon neutrality in China. Nat Rev Earth Environ 3, 141–155 (2022). https://doi.org/10.1038/s43017-021-00244-x
Accepted:
Published:
Issue Date:
DOI: https://doi.org/10.1038/s43017-021-00244-x
This article is cited by
-
Strategic interactions for carbon emissions in Chinese cities are influenced by mayors
Nature Cities (2024)
-
Determinants and their spatial heterogeneity of carbon emissions in resource-based cities, China
Scientific Reports (2024)
-
Research on the estimation and spatial pattern of net tourism carbon emissions in the Yellow River Basin from 2009 to 2019
Environmental Science and Pollution Research (2024)
-
Sustainability governance for agrarian transformation under climate change
Sustainability Science (2024)
-
Electrochemical Carbon Dioxide Reduction in Acidic Media
Electrochemical Energy Reviews (2024)
